SOL shortsThe SOL chart is currently exhibiting a bearish pattern, indicating potential downward pressure on the cryptocurrency. Should the neckline be breached, it could signal further declines in its value.
SOLUSDT.PS trade ideas

SOL - PERFECT Levels still played out.18th April i published a SOL TA/Signal and updated it through days.
Those given Levels played out again and again and have some nice profits.
Days ago : "We are ready to short below POC or long above hVn or loc Daily :)"
Look how those 3 Levels played out nicely. Even with nice retests.
loc-D and 2x hVn. 🎯 👌
5-6 Trades though days ...
Look at all previous SOL TA and more important at that TA about Alts days ago to understand the levels and lines.
Alts TA:
previous SOL Signal:
Follow for more ideas/Signals.💲
Check out my previous TA/Signals which played out nicely. :)
Just donate some of your profit to Animal rights or other charity :)✌️

SOL SCALP.SOL brokestructure on the 1h timeframe with a valid orderblock as seen on the chart. Bias is generally bullish. This is a more riskier setup as I've analysed that SOLANA is going lower because of the HTF OB. Because they always outperform the LTF :). For riskier setups always use .5% risk or less.
I always appreciate a follow :) keeps me going.

SOLSOLANA has been ranging for a quite a while in a untradeable and choppy style therefore I obstained from trading it. I am now looking for a sweep of liq either SSL or BSL before entering a trade. My POI are marked with the blue lines of the graph as they are daily orderblocks.

Sol Solana looks like it'll go in both direction but I am in favour of bulls I won't be surprised if their is a big push to the upside soon

SOL/USDT 1H: Distribution Phase – Short Setup Below $150SOL/USDT 1H: Distribution Phase – Short Setup Below $150
🚀 Follow me on TradingView if you respect our charts! 📈 Daily updates!
Current Market Conditions (Confidence Level: 8/10):
Price at $148.45, showing neutral-bearish structure after rejection at previous candle high (PCH).
Hidden bearish divergence visible on RSI, signaling potential downside continuation.
Market Makers actively distributing within premium zone ($152 – $154).
Trade Setup (Short Bias):
Entry: $148.40 – $148.60 range.
Targets:
T1: $146.20
T2: $144.80
Stop Loss: $150.20 (above PCH and resistance zone).
Risk Score:
7/10 – Strong rejection at $150.00 – $150.50 resistance supports setup, but minor bounce risk due to oversold RSI.
Key Observations:
Resistance cluster confirmed at $150.00 – $150.50.
Volume profile supports bearish continuation, with recent breakdowns in market structure.
Smart Money likely positioned short after multiple liquidity sweeps at highs.
Distribution signals align with hidden bearish divergence on RSI.
Recommendation:
Short positions favored within entry zone with stop above $150.20.
Consider scaling profits at $146.20 and $144.80 to maximize reward.
Monitor price action around $146.20 for potential absorption or stronger breakdown.
🚀 Follow me on TradingView if you respect our charts! 📈 Daily updates!

Stromm | SOLANA Key Zones for Next MovesWe've seen a very solid reaction here — similar to Bitcoin, but still with its own flavor.
The Previous Monthly Low was swept and then reclaimed, which is always a strong bullish signal.
On top of that, the Monthly Open was reclaimed and successfully retested, flipping market structure back to bullish.
No doubt: the trend right now leans upward.
The big question is: where do we go from here?
When you look left on the chart, you see two massive candles:
One day, +30% straight up,
Followed by -22% the very next day.
Pure chaos.
Now, price is pushing back into that zone — and we need to watch how it reacts inside those previous candles.
For targets:
The Weekly Fair Value Gap near the Previous Monthly High is a major zone to watch.
After that, there’s the 2h Fair Value Gap around the Yearly Open — the next big magnet for price.
And it’s worth noting:
Compared to Ethereum, Solana’s Yearly Open is way closer and much more realistically within reach. Another subtle hint that SOL is showing way better relative strength.

Sol Daily chart setting up for a moveCRYPTOCAP:SOL
Daily chart looks good, Might go for another push into $170 in my opinion

SOL long 50%50% retrace and higher high market structure shift on 5-15m with stop loss under previous low. Looking for a 1:3 RRR at the near highs of the 50%

SOL SHORTShorting solana on the weekly bearish OB at 166.6 and my second entry at precisely 170.
Targeting 150s and lower.
Goodluck

#SOL/USDT#SOL
The price is moving in a descending channel on the 1-hour frame and is expected to continue upwards
We have a trend to stabilize above the moving average 100 again
We have a descending trend on the RSI indicator that supports the rise by breaking it upwards
We have a support area at the lower limit of the channel at a price of 134
Entry price 137
First target 140
Second target 144
Third target 149

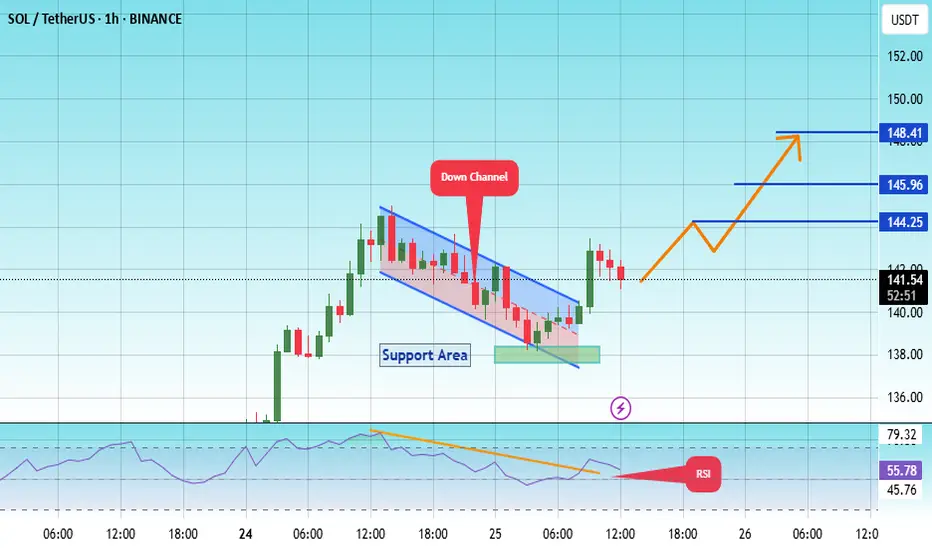
#SOL/USDT#SOL
The price is moving within a descending channel on the 1-hour frame, adhering well to it, and is heading for a strong breakout and retest.
We are seeing a bounce from the lower boundary of the descending channel, this support at 138.
We have a downtrend on the RSI indicator that is about to be broken and retested, supporting the upward trend.
We are looking for stability above the 100 moving average.
Entry price: 142
First target: 144
Second target: 146
Third target: 148
#SOL/USDT#SOL
The price is moving within a descending channel on the 1-hour frame and is expected to continue lower.
We have a trend to stabilize below the 100 moving average once again.
We have a downtrend on the RSI indicator that supports the upward move with a break above it.
We have a resistance area at the upper limit of the channel at 127.
Entry price: 126
First target: 124
Second target: 122
Third target: 119

SOL/USDT SOL currently testing support line of, as well as testing recent fair value gap. if your trade continue in solana then no need of close trade just update stop loss, for fresh the can start trade with
Target 01 : 164.00
Target 02 : 179.00
Stop loss : 133.00

solona SOL/USDT: Key Levels to Watch
SOL/USDT trades at 146.66 (+2.94%), showing bullish momentum but facing key tests ahead.
Critical Levels
- Support: 142.12 (immediate), 138.21 (strong), 130.00 (major)
- Resistance: 151.10 (breakout zone), 155.00 (next target), 160.00 (major hurdle)
Outlook
- Bullish: Holding 142.12 and breaking 151.10 could push SOL to 155-160.
- Bearish: Losing 142.12 may trigger a drop toward 138 or 130.
Watch RSI (60.57) and MACD (4.88) for momentum clues.
Trade wisely—always confirm with volume and price action.

Solana structur-update ElliotWaveBINANCE:SOLUSDT
I'm still anticipating the same pattern; the only change is an additional high in wave 3.

SOLANA → Pre-breakout consolidation relative to 136.00BINANCE:SOLUSDT relative to the range support forms a false breakdown. The market reacts quite positively and the price recovers, forming a consolidation in front of strong resistance
Bitcoin is also in consolidation, as well as SOL, in general the movements coincide, but lately bitcoin is leading relative to the stock market.
SOL is in consolidation in front of a strong resistance level at 136.00. The primary test may end with a small correction to 0.5 fibo, or consolidation near the level, but a breakout and price consolidation above the current consolidation will be a positive signal for continued growth. The global trend reversal is out of the question, we are aiming at local targets, such as 140, 147, 152.
Resistance levels: 147,152
Support levels: 129, 123, 111
In general, the global market situation is bearish, the local situation is neutral as the price is in a sideways range. A false breakdown was formed against the support of the current range. Technically, due to liquidity imbalance (after the false breakdown) the price may head towards such zones as 147 - 152
Regards R. Linda!

SOL/USDT:BUYHello friends
Due to the price correction, we can buy in two specified areas in a stepwise manner, with capital and risk management.
*Trade safely with us*

SOLANA BREAKS BULLSolana is putting on a clinic in technical structure.
The recent move through $147 wasn’t just a breakout - it was the first higher high since the downtrend began back in January. That’s a major shift in character. So far, we’ve also seen a classic break and retest of that level, which is now acting as support.
Price sliced through descending resistance, flipped the 50-day moving average, and hasn’t looked back. Volume backed the breakout, and while the 200 MA still sits overhead, SOL is showing serious strength.
We called this one at the breakout - and so far, it’s following the script perfectly.

$136 Resistance Crumbles: Solana Bulls Take the Lead...Solana Breaks Key Resistance – Eyes Set on $150 and $180 Targets
Solana (SOL) has successfully broken through the strong resistance level at $136 after several failed attempts, signaling a potential continuation of its current uptrend. This breakout marks a significant technical milestone for SOL, which had previously struggled to maintain momentum above this price zone.
If Solana is able to hold above the $136–$137 level, it could open the door for further gains, with short- to mid-term price targets around $150 and $180. The breakout aligns with broader bullish sentiment in the crypto market and may attract new buyers looking to ride the trend.
For traders or investors interested in entering a position, the $136–$137 range could offer a potential entry point, provided the breakout holds and is supported by volume. As always, proper risk management is recommended, and watching for confirmation on the next few candles could be key.


SOLUSDT SOLUSDT Analysis 📊
🔹 Support Levels: 118, 112, and 107 USD
🔹 Resistance Levels: 130 and 150 USD
✅ The price has reacted positively after testing the 118-112 USD support zone, showing a short-term bullish move with increasing volume.
📉 If the price fails to break 130 USD, a pullback to 118 USD is possible.
📈 A breakout above 130 USD could pave the way for a move toward 150 USD.
🔍 Conclusion: The bullish trend remains unconfirmed until 130 USD is broken.

SOL | Short-Term Long | Key Resistance | (April 2025)SOL | Short-Term Long | Key Resistance & Liquidity Flip | (April 2025)
1️⃣ Short Insight Summary:
Solana has reached a critical resistance zone after a wave of short liquidations. While the broader crypto market is showing strength, SOL is at a decision point that requires caution.
2️⃣ Trade Parameters:
Bias: Short-term Long (with tight risk control)
Entry: Around current price near resistance (approx. $125–$128)
Stop Loss: Just below recent swing lows (can adjust based on volatility)
TP1: $138
TP2: $131
✅ Quick partial profits planned due to high-risk reversal potential at current levels.
3️⃣ Key Notes:
We’re sitting at a strong resistance zone that has seen multiple overlaps in recent days. A major round of short positions was recently liquidated, which could fuel a push higher — but also makes this a tricky zone for continuation. Watch for reversal signs, and manage risk tightly. Overall market sentiment is leaning bullish, which supports the long-term potential for SOL if it can break through.
4️⃣ Follow-up Note:
Will reassess based on how price reacts around $131 and $138. May update if momentum picks up or structure changes.
Please LIKE 👍, FOLLOW ✅, SHARE 🙌 and COMMENT ✍ if you enjoy this idea! Also share your ideas and charts in the comments section below! This is best way to keep it relevant, support us, keep the content here free and allow the idea to reach as many people as possible.
Disclaimer: This is not a financial advise. Always conduct your own research. This content may include enhancements made using AI.
