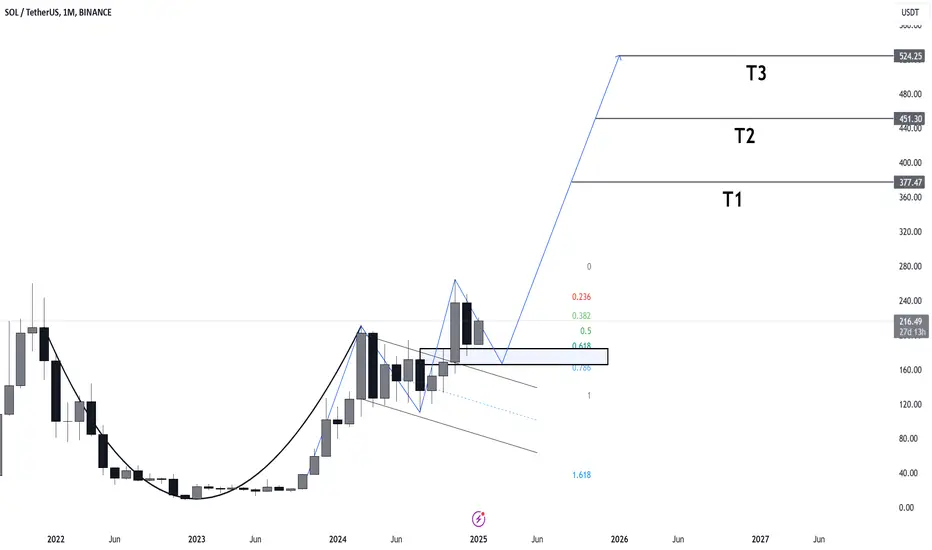
SOL is setting up for a massive breakout!
#SOL has completed a textbook cup-and-handle pattern and is holding above key support levels 👀
Major targets are positioned at T1: $377.47, T2: $451.30, and T3: $524.25, highlighting huge upside potential 🎯
In my opinion, CRYPTOCAP:SOL is primed for explosive growth as the bullish momentum builds 🚀
SOLUSDT.PS trade ideas
SolAna "🌟 Welcome to Golden Candle! 🌟
We're a team of 📈 passionate traders 📉 who love sharing our 🔍 technical analysis insights 🔎 with the TradingView community. 🌎
Our goal is to provide 💡 valuable perspectives 💡 on market trends and patterns, but 🚫 please note that our analyses are not intended as buy or sell recommendations. 🚫
Instead, they reflect our own 💭 personal attitudes and thoughts. 💭
Follow along and 📚 learn 📚 from our analyses! 📊💡"

Get Ready for Solana’s Boost: More Gain Coming SoonHello and greetings to all the crypto enthusiasts, ✌
In several of my previous analyses, I have accurately identified and hit all of the gain targets. In this analysis, I aim to provide you with a comprehensive overview of the future price potential for Solana , 📚🎇
Solana has outperformed Ethereum in key performance metrics recently, thanks to its skilled development team and strategic updates that continue to solidify its leadership in blockchain innovation.
With a strong foundation in place, a price target of $265—offering a 29% potential gain—seems very realistic. Technical analysis also supports this optimistic outlook, suggesting the upward trend will likely continue.
🧨 Our team's main opinion is: 🧨
Solana has outperformed Ethereum recently, with a strong foundation and strategic updates, making a $265 price target and 29% potential gain very achievable.
Give me some energy !!
✨We invest countless hours researching opportunities and crafting valuable ideas. Your support means the world to us! If you have any questions, feel free to drop them in the comment box.
Cheers, Mad Whale. 🐋

Bullish Breakout: Solana's Wedge Reversal and Fibonacci Surge### Trading Strategy Explanation
1. **Falling Wedge**: This pattern is visible from the downward sloping lines containing the price action, ending in converging trendlines. This pattern typically indicates a bullish reversal, suggesting an upcoming uptrend after the breakout.
2. **Elliott Wave Correction Pattern**: The analysis incorporates Elliott Wave theory, specifically focusing on a corrective ABC pattern following a five-wave impulse decline. Point B in the ABC correction falls between the 0.618 and 0.5 Fibonacci retracement levels, which are considered strong levels for potential entries as they often act as reversal points in the price of an asset.
3. **Trade Execution**:
- **Entry**: The strategy proposes entering the trade within the range of the 0.618 to 0.5 Fibonacci levels, which are historically significant for price reversals. So the entry for this strategy is right at this moment.
- **Stop Loss (SL)**: The SL is set just below the 0.236 Fibonacci level, providing a buffer to accommodate price fluctuations without exiting the trade prematurely.
- **Take Profit (TP)**: The initial take profit is set at the 1.618 Fibonacci extension, often referred to as the "golden ratio," a common target in trading for significant price movements.
But before this TP, there is another TP level at 139 where we take 50% Profit and move our SL to the entry. This is to prevent any loss so either we walk away with 50% Profit or more. But we cannot loose anything anymore. This TP is set to 139 because thats where there is the order block and that is where there is poin A located from the EW Correction Wave.
4. **Order Blocks and Price Behavior**:
- The strategy outlines two order blocks (areas where significant buying or selling occurred previously) expected to either serve as resistance or support. The price is anticipated to either:
- Bounce off the first order block, then pull back, or
- Break through, retest, and then proceed to the second order block.
- A partial profit (50%) is taken at the first order block around $139, and the SL is moved to the entry point to prevent losses, ensuring a risk-free trade moving forward as mentioned before. So either way we would walk away in Profit.
5. **Bearish Trend Line and Price Retest**:
- After breaking the bearish trend line, the strategy anticipates a possible retest of this line. A successful retest and bounce off this line would further confirm the bullish outlook and continuation of the uptrend toward the equilibrium or higher resistance levels.
### Summary
This trading idea focuses on leveraging technical patterns and Fibonacci levels to set strategic entry and exit points, mitigating risk while aiming for potential high reward. The detailed use of Elliott Wave for trend analysis combined with the Fibonacci retracement for pinpointing entry and stop-loss levels, and taking profits at key Fibonacci extensions, makes this strategy robust for traders looking for precise market entry and exit points.

SOLUSDTAs we can see, the whales didn’t let the price drop below the line I marked. Additionally, the average volume hasn’t even been touched, which suggests they don’t want the price to go any lower. That said, it’s still a matter of waiting to see what happens.
Do you think the next target could be +420?

Solana to All time high soon!Solana's downtrend has just been broken on the daily chart. RSI is also primed right around 60. I'd expect a small pullback to retest the breakout around 210-212 and if it bounces and then confirms the breakout by breaking over 220. We should be off to the races for the retest of all time high at 264.
This is not financial advice, trade at your own risk!

SOL long set up reviewBINANCE:SOLUSDT
In this chart, you can see that SOL has formed a symmetrical triangle pattern and successfully broke out. At this point, the target price can be calculated: the distance from the base of the triangle (as shown by the orange line) will determine the target price. The stop-loss should be set below the consolidation zone.


Scalp in 4hKey Points:
Price Trend: SOL is currently in a downward trend but nearing a support zone, hinting at possible reversal or further decline based on breakout direction.
Strategy : Patience is key; traders should wait for clear breakout signals before entering trades, with attention to Fibonacci levels for setting targets or stops.
Risk Management : Important in volatile markets like crypto; setting stop-losses near key Fibonacci levels or recent lows/highs is advised.

Solana (SOL/USDT) Technical Analysis: Critical Levels and PotentIn this analysis of Solana (SOL/USDT), we dive into the key market structure and Fibonacci retracement levels that could guide the next price movements. The 4-hour timeframe reveals a corrective wave structure with crucial levels to watch, offering an excellent setup for both short-term and long-term traders.
Key Insights:
Retracement Zone Resistance (202.17–208.50 USDT):
The price is currently approaching a significant resistance zone between the 50% (202.17) and 61.8% (208.50) Fibonacci retracement levels of the previous wave.
This area could act as a reversal point, triggering either a continuation to the downside or a breakout to higher levels.
Bullish Scenario:
If the price breaks above the 208.50 USDT resistance, we could see a bullish continuation toward 230 USDT or higher. This move would indicate strong momentum and buyer dominance.
Bearish Scenario and Key Support Zone (160.00–165.30 USDT):
A rejection from the resistance zone could push the price downward toward the highlighted support zone around 160.00–165.30 USDT. This area aligns with key market structure and presents a potential accumulation zone for long positions.
Momentum Indicators:
The stochastic oscillator is currently in the overbought territory, suggesting that a correction or pullback could be imminent. However, confirmation from price action is essential.
Strategy Suggestions for Traders:
Aggressive Traders: Watch for rejection signals in the 202.17–208.50 USDT resistance zone to initiate short positions, targeting the 160.00–165.30 USDT support area.
Conservative Traders: Wait for a clear breakout above 208.50 USDT or a bounce from the 160.00–165.30 USDT support zone to enter long positions with reduced risk.

SOL to longSol is moving in an upward trend.
A long position can be opened from
Entry : 183
Target price : 201
Stoploss: 174.50

Long Signal for Solana (SOL) | 100% Profit Potential with 1:5.5 📉 Analysis: Solana (SOL) has completed an ABC correction and successfully broken its descending trendline, signaling the start of a strong bullish move. This setup offers an excellent 100% profit potential with a 1:5.5 risk-reward ratio.
📌 Key Levels:
- 🔹 Entry Point: 213.50 USD
- 🔹 Stop Loss: 174.00 USD
- 🔹 Take Profit: 430.00 USD
📊 Outlook: The break above the descending trendline confirms a change in momentum, making SOL ready for its next major move upwards. A perfect setup for traders looking for high returns with calculated risk.
📢 Share your thoughts! Don't forget to share this signal with your trading circle and let us know your plans in the comments.


#SOL: Riding the Wave of Blockchain ScalabilityDescription:
This trading idea centers on SOL, the native token of the Solana blockchain, a high-performance platform designed to support scalable and fast decentralized applications. Solana’s unique consensus mechanism, combining Proof of History (PoH) with Proof of Stake (PoS), allows it to process thousands of transactions per second at low costs, making it a strong competitor in the blockchain ecosystem. SOL serves as the backbone of this ecosystem, powering smart contracts, staking, and transaction fees while fostering rapid adoption across DeFi, NFTs, and Web3 projects.
With its growing developer community, expanding use cases, and increasing institutional interest, SOL is well-positioned to maintain its relevance as one of the leading blockchain platforms. However, the cryptocurrency market is inherently volatile, influenced by external factors like regulatory changes, technological advancements, and shifts in investor sentiment. Proper risk management is crucial when trading or investing in SOL.
Disclaimer:
This trading idea is intended for educational purposes only and does not constitute financial advice. Trading cryptocurrencies like SOL carries significant risks, including the potential for the complete loss of capital. Always perform your own research, evaluate your financial circumstances, and consult a professional financial advisor before making investment decisions. Past performance is not indicative of future results.

SOLANA - Will it beat BTC in M.cap?SO this is what i had drawn for solana, I was willling to buy at 179 being to get a good DCA, it got reversed from the point mentioned.
Forgot that Crypto market pennants happen on trrends so likely this is going to work as mentioned

SOL update #SOL is making a triangle with 5 waves like ABCDE the market has targeted the supply zone and after that there will be a down move I think that's the E wave

$SOL/USDT Analysis#SOL has broken the Diagonal Trendline in the 4-Hour TF!
✅ Plan: Wait for a successful retest before considering a long position.
🔑 Key Levels:
Local Resistance: PMH $247.3
Local Support: PML $175.25

SOL/USDT Analysis
Key Market Setup
Fibonacci Retracement: SOL is currently retracing near the 0.618 Fibonacci level, a critical support zone for bullish reversals.
Breakout Confirmation: A strong breakout from the previous descending trendline has shifted momentum to bullish.
Projected Targets 📈
🎯 Target 1: $262.12
🎯 Target 2: $301.59
🎯 Target 3: $338.89


$SOL/USDT Trading IdeaSolana popped 9.63% straight out of our local demand zone, a nice little pump. The previous highs are about 26.91% away. Now send it higher after a clean breakout.


UpdaSolana Ute on Solana - Breakout Has Happened! Where To Next?👀 👉 As highlighted in yesterday's video, we can now observe that Solana has broken structure to the upside on the 4-hour timeframe. This move is unfolding as anticipated, and I’m currently watching for a retracement into the 50-61.8% Fibonacci zone for a potential buy setup. Any buy decision will depend on price action aligning with the analysis discussed in the video. Please note, this is not financial advice. 📉✅
