Patience Pays: Get Ready for the Altseason Boom!The altseason is coming, and when it begins, the opportunities will be limitless! 🚀
💡 Preparation is Everything
While the market gears up for its next big move, now is the perfect time to lay the foundation for success.
Here’s how you can prepare:
📊 Study the Charts: Analyze historical patterns, identify key levels, and understand market cycles. Knowledge is power.
🔍 Analyze Fundamentals: Dig into projects, assess their potential, and separate hype from value. A strong foundation beats speculative bubbles.
🛠️ Build a Trading Plan: Define your entry, exit, and risk management rules. Stick to them—discipline is what separates winners from losers.
🏆 Identify Key Tokens: Focus on projects that combine innovation, strong fundamentals, and market potential. Preparation now will save you from FOMO later.
🚀 Positioning for the Next Bull Run
The altcoin market is known for its incredible pumps during bull runs. Massive % gains are achievable, but success requires patience, preparation, and a strategy.
Think of the market as a game of chess:
Plan your moves in advance.
Wait for the right opportunities.
Strike when the time is right.
The next bull run could create generational wealth for those who are prepared. The markets are warming up— are you ready for takeoff? 🚀
Let’s navigate this journey together. Share your favorite altcoins and strategies in the comments below! 👇
#Altseason #CryptoTrading #PatiencePays #TradingStrategy #BullRunReady #CryptoCharts
SOLUSDT.PS trade ideas

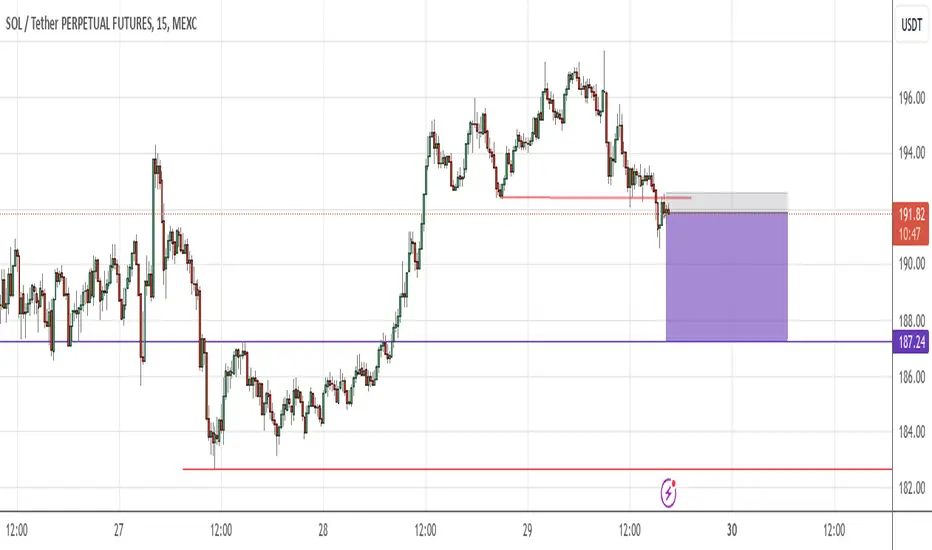
$SOL ShortMEXC:SOLUSDT.P ptice took out lower low on m15, shorting it back to previous higher high on m15 breakout $187.
Solana finds 180 Support and DEX Volume aim Q1 2025Technically - Day trend
After slipping below the crucial support levels of 220 and 215, Solana has now descended to test the 180 support line—previously a resistance on October 29, 2024. Excitingly, the SMA 5 is crossing over the SMA 10, signaling a potential upward trend ahead! Keep an eye on this development; it might just indicate a shift in momentum for Solana!
DEX Volume
Additionally, Solana’s dominance in DEX volume has been evident lately, surpassing $100 billion for another month. It continued to lead other chains too. Ethereum followed with a trading volume of $77.201 billion – A sign of a competitive, but lower performance.
Other platforms like Base and Binance Smart Chain (BSC) reported volumes of $44.51 billion and $41.739 billion, respectively, further highlighting Solana’s market lead.
Smaller chains like Arbitrum, Sui, and Avalanche contributed $30.432 billion, $9.24 billion, and $7.332 billion, respectively. These findings were a sign of their growing, but still modest share in the DEX market.
Finally, the anticipated altcoin rally projected an uptrend in the total market cap, specifically highlighting an altcoin season.
This pattern suggested that SOL, while already exhibiting bullish tendencies, could benefit significantly as market conditions favor altcoins.
With the market cap surpassing $3.36 trillion, the environment appears to be ripe for a Solana rally right now. Especially in the first quarter of 2025. This could potentially drive SOL to new highs, paralleling or even surpassing its previous peaks.
Monitoring Solana closely is crucial as it could mirror or capitalize on the broader altcoin surge, enhancing its valuation and market position.

Update on Solana USDT leverage trade... High profitThis is an update on my last post. The Sol trade worked as I predicted now you should move your SL in to profit . You could already take your profits but I would recommend to wait because it could easily go up to 198-200 .
What is your idea?
Stay tuned, and I’ll catch you in the next one — peace!


Solana Is In A Good Spot! My StrategyHey everyone,
here's a breakdown of my mid-term strategy for Solana (SOL/USDT). We're focusing on simple but effective rules, such as a Support & Resistance flip, which is happening as we speak.
Based on my experience (this is my third cycle), these steep corrections are great opportunities to add different altcoins to your portfolio and in some cases, take a leveraged position. 2025 will be bullish for crypto. And Solana is one of the better picks in this market.
If you like these kinds of explanatory ideas, please let me know in the comments.
Best,
Anton

SOLANA H4 OUTLOOKThis chart depicts the analysis of SOL/USDT price action on the 4-hour timeframe on Binance. Key points from the analysis are as follows:
1. Downtrend Channel:
• The price is within a descending channel (orange dashed lines), indicating a bearish trend with dominant selling pressure.
2. Golden Cross:
• A “golden cross” is observed (a bullish crossover of short-term and long-term moving averages), suggesting a potential upward reversal.
3. Liquidity Zones:
• Buy Side Liquidity (BSL): Highlighted by horizontal blue lines at higher price levels (e.g., $211.86 and $234.12). These zones are potential targets where buyers might drive prices up.
• Sell Side Liquidity (SSL): Highlighted by horizontal red lines at lower price levels (e.g., $183.83 and $176.60). These zones are targets for selling pressure.
4. Stop Hunt (SH):
• The “SH” labels mark possible areas where price could grab liquidity before reversing (e.g., upward for lower SH or downward for upper SH).
5. Entry Points:
• Entry 1: $197 (solid orange line): A potential buy entry point if the price breaks below the SSL zone and signals a reversal.
• Entry 2: $187: A lower-level buy entry if the price touches additional SSL.
6. Price Projection:
• The zig-zagging blue line indicates a potential price movement toward BSL (bullish). liquidity grabs around SH zones before heading upward.

correction on my last post Solana Nearing $200: A Potential Day Solana is on the verge of hitting the $200 mark if there is a breakout. For day traders, this could be a great chance to lock in some profits. I’m planning to wait briefly after the breakout to see if it’s just a fake breakout. If the price continues to rise, I’ll open a long position and aim to close it at $200. My stop-loss is currently set at $183 and will be adjusted based on price action, so it eventually moves into positive territory.
What’s your take on this? Let me know!
Stay tuned, and I’ll catch you in the next one — peace!

Solana Nearing $200: A Potential Day Trader’s OpportunitySolana is on the verge of hitting the $200 mark after breaking out. For day traders, this could be a great chance to lock in some profits .
I’m planning to wait briefly after the breakout to see if it’s just a fake breakout. If the price continues to rise, I’ll open a long position and aim to close it at $200. My stop-loss is currently set at $183 and will be adjusted based on price action, so it eventually moves into positive territory.
What’s your take on this? Let me know!
Stay tuned, and I’ll catch you in the next one — peace!

Solana: Potential Breakout Above $250?Provide a brief overview of your analysis and explain why this analysis is significant for readers.
Example:
"Solana (SOL) has been showing strong price movements recently. In this analysis, we’ll explore the key support and resistance levels, a potential breakout scenario, and the implications for both short-term and long-term traders
Technical Analysis:
Present the details of your analysis. Include your chart image and explain it using the text below:
Trendlines and Key Levels:
"The chart clearly shows that SOL has broken a long-term descending trendline. This breakout indicates a potential bullish continuation. However, the critical support zone between $180–$200 (highlighted in purple) will play a key role in determining the next move."
B) Resistance Levels:
"The major resistance lies above $250, where previous sellers have dominated. A confirmed break above this level could lead to a strong rally, potentially targeting $300 or higher."
C) Projection Scenarios:
"As shown in the chart, there are two possible scenarios:
If the price holds above the $180–$200 support zone, we could see a continuation to the upside.
A failure to hold this zone may result in further downside pressure, retesting lower levels around $150."
Fundamental Analysis:
If you have any fundamental analysis, include it in this section.
Example:
"With increasing adoption of Solana's ecosystem and its recent updates, the fundamentals support a potential price increase. However, macroeconomic factors and Bitcoin's dominance will also influence SOL's trajectory.

SOL Update 12HI believe Solana is in a good position and is suitable for Buy . I'm planning to make one Buy at this level and another around the $170 Zone . Please do your own research as well. This is not a buy or sell recommendation 🫡

Solana Analysis: Key Levels and Trading Perspectives 24.12.28Hello, this is Greedy All-Day.
Today’s analysis focuses on Solana (SOL).
Daily Chart Overview
Starting with the daily chart, Solana has experienced a dramatic rebound after a 97% drop from its peak in November 2021. After nearly three years, it has risen back to the 267 resistance level but has struggled to break higher.
The key question here is whether Solana will surpass critical levels to aim for new all-time highs or if it will return to a corrective or bearish trend.
Buy Perspective
From a buying perspective:
Currently, Solana has dropped below the Ichimoku Cloud and is showing resistance at the cloud level on the daily chart.
A breakout of the resistance trendline may act as a signal for a short-term rebound, but for a more conservative approach, Solana must stabilize above the Ichimoku Cloud.
The first buy entry is at the green box breakout, roughly around 230. If Solana moves above this level, it could signal a renewed push toward all-time highs.
The second buy entry is at the 267 breakout. This level has served as resistance twice, so breaking it would likely lead to the formation of a new price frame with significant volume, signaling a strong upward trend.
Sell Perspective
From a selling perspective:
The short-term ascending trendline has already been broken, and a retest showed resistance, leading to a decline.
The blue box zone is a critical support level to monitor.
If this support fails, Solana is likely to drop further to the green box supply zone below. If you missed the initial entry at the trendline break, the blue box breakdown serves as the first signal for a sell position.
Key Long-Term Level
One of the most critical levels for Solana is the red box zone.
The red box is closely aligned with the long-term ascending trendline and has previously served as a pivotal support level.
Historically, a breakdown of this zone led to a prolonged bearish trend.
Currently, the 78 level in the red box is far below the current price, but in the volatile world of crypto, unexpected moves can occur. For now, keep this level in mind as a reference point for long-term analysis.
Conclusion
Solana has the potential to rise if key resistance levels are broken, but for now, the trend appears to have shifted back to bearish.
Be cautious and monitor critical levels like the Ichimoku Cloud, 230, and 267 on the upside, and the blue box zone and 78 level on the downside.
Let’s trade smart and stay prepared for both opportunities and risks. 🚀

SOLUSDT - Directions for Buys Placed - 179.50SOLANA ideally chucking and looks beautiful on this green point. IDeally 179.50 to 176.5 is the initial point of buys

SOLUSDT --> Consolidation. One step away from a rally!BINANCE:SOLUSDT is in the correction phase, within which the price tested the previously broken consolidation boundary.
The focus is on the flat channel 205 - 180.
False break of support will provoke further growth. As well as a break of resistance and price consolidation above 205.
SOL has good fundamental and technical prospects and the coin may show something interesting in 2025

I see SOLANA above 320 (Ready to takeoff) Entire Market is green but SOL is red.
This recent and sudden decrease in SOL’s price (within hours) suggests Bears are watching and wanna drag it down.
Anyways, SOLANA is about to jump in a “Money Train”.
To all the Crypto Traders get ready:
As soon As SOLANA hits 190 mark , keep your tools blazing hot ready and jump on the train. Its gonna be a Fast ride thus Furious.
Trust No Exchange
Trust No Broker
Use Extreme Risk Management and always keep back up ready in your “left wallet”.
Time to go.
I see SOLANA above 320

SOL/USDT 1W Chart ReviewHello everyone, let's look at the 1W SOL to USDT chart, looking at the large time frame, we can see how the price is moving in the uptrend channel in which we currently have a visible correction approaching the lower part of the channel.
Seeing the current correction, which most likely held on support at our first stoplos, we will designate the locations of the next potential SLs:
SL1 = 184 USD
SL2 = 166 USD
SL3 = 143 USD
SL4 = 117 USD
However, if the price changes direction and the visible green candle starts gaining strength, it is worth moving on to setting goals for the near future, which include:
T1 = 211 USD
T2 = 234 USD
T3 = 253 USD
T4 = 271 USD
