SOL Analysis Deep Dive: Identifying Optimal Entry and Exit ZonesYesterday, SOL gave a sharp downside shakeout, dropping from the weekly open at $147.98 (perfectly retested) down to the 0.5 Fib retracement of the swing at $140.25. Here’s a structured breakdown of the key levels, trade setups, and R:R profiles for both longs and shorts:
🔑 Key Levels & Confluences
1. Higher-Timeframe Opens
Weekly Open & Retest: $147.98 – pivoted price before the drop
Monthly & Prior-Day Open Cluster: $147.98–$146.31 – strong support confluence zone
2. Fibonacci Support Zones
0.5 Fib at $140.25 – primary mean-reversion entry
0.786 Fib (smaller wave) at $138.78 – secondary, deeper support
3. Order Block
Daily Bullish Order Block at $139.87 – just below 0.5 Fib, adds extra support
4. Volume-Weighted Average Price
Anchored VWAP (from ATH $295.83) at ~$166.45 – key upside resistance
5. Market Profile Value Areas (10-Day Range)
Value Area High (VAH) at ~$153.00 – overhead resistance confluence
Value Area Low (VAL) at ~$145.75 – underpins support
📈 Long Trade Setups
1. 0.5/0.786 Fib + Daily Bullish Order Block
Entry: $141-138.78
Stop-Loss: $137.5
Target: $165 (anchored VWAP / Fib zones)
R:R ≈ 9:1
2. Higher-Timeframe Open Cluster
Entry Zone: $147.98–$146.31(monthly/weekly open)
Stop-Loss: $142.5
Target: $165
R:R ≈ 3:1
• Why these levels? The 0.5 Fib is a classic mean-reversion zone, bolstered by the daily order block. The $147–146 zone ties together multiple opens (weekly, monthly, prior-day), offering a solid demand area if price retraces back up.
📉 Short Trade Setup
Trigger: Rejection / swing-failure around $153.4
Entry: $153.4
Stop-Loss: $154.3
Target: Weekly/Monthly open (~$147)
R:R ≈ 6:1
• Low-risk short: A clean rejection at the recent high lets you define risk tightly above the swing, aiming to capture the retrace back to the opens.
🎯 Summary & Game Plan
Primary bias: Look for long entries at the 0.5 Fib ($140.25) or the open-cluster zone ($147–146), with targets toward the anchored VWAP at ~$166.
Alternate bias: A short on clear rejection from $153.4, targeting the opens as support.
Risk management: Keep stops tight (SL below $137.5 or above $154.3) to maximize R:R on your favored setups.
Volume & Price Action: Confirm entries with an uptick in volume or bullish price structure (for longs) or swift failure patterns (for shorts).
Now it’s a waiting game! Let price revisit these zones, watch for confirmation signals, and then scale into your chosen side. Good luck! Don't chase, let the charts come to you!
____________________________________
If you found this helpful, leave a like and comment below! Got requests for the next technical analysis? Let me know.
SOLUSDT trade ideas

SOLANA → Resistance level and free zone for growth up to 180.0BINANCE:SOLUSDT.P is holding steady and consolidating near the resistance level of the global price range of 152.85–111.85. Thus, the market has signaled that it is in a positive mood. A trigger is ahead...
SOL is forming a flag consolidation near the upper border of the trading range of 152 - 111, which indicates the accumulation of pre-breakout potential. A breakout from the flag, a break of resistance, and consolidation above 152.85 could provide support and growth. The cryptocurrency market is reviving after yesterday's news and relatively positive data in the tariff war. Countries are gradually beginning to agree, which is generally supportive for the crypto market.
Resistance levels: 152.85
Support levels: 144.6, 141.2
A breakout of the resistance range of 152.85 and consolidation of the price above this level will confirm the readiness for further growth. Further on, there is a free zone and the price can easily reach 180.00.
Best regards, R. Linda!

SOL Hits Major Resistance — Patience Over FOMOOne of the most common mistakes traders make—especially in fast-moving markets—is jumping into trades impulsively at major resistance. It feels exciting when price is surging, but ironically, this is often where risk is highest and reward is most limited.
Why? Because historical resistance zones—like the $175–$183 region on SOL—tend to attract heavy sell pressure. These are levels where many past buyers look to exit, where smart money hunts liquidity, and where false breakouts are most common. Without volume confirmation and a proper retest, breakouts through such zones often fail.
That’s why experienced traders wait. The smarter approach is to let the market come to you, and only act when one of two things happens:
A pullback into a well-defined, confluence-rich support zone
A clean breakout above resistance, followed by a retest and confirmation
SOL has respected structure beautifully, but now is not the time to chase. Either wait for a healthy correction into support, or let price prove its strength through a confirmed breakout. No trade is also a trade — and capital preservation is the foundation of long-term success.
Patience isn’t passive — it’s a strategy. Let the market come to your desired levels. You don't need to catch every move, only the high-probability trades and there aren’t born from impulse — they’re built on patience, structure, and right timing. 💎
Technical Breakdown
SOL has entered a major resistance zone between $175 and $183 — a historically significant level respected for over a year.
Within this zone lie two key highs:
$179.85: Recently swept with a clean Swing Failure Pattern (SFP)
$180.52: Still untested — if broken, it would confirm a strong bullish continuation
Breaking through such a well-established resistance on the first attempt is uncommon — it typically requires momentum and structure. A rejection here would suggest that SOL needs a healthy correction before mustering the strength for a true breakout.
📉 Elliott Wave Count
Looking at the structure, we’ve completed a 5-wave sequence — signaling the potential end of this impulse leg. According to Elliott Wave Theory, a corrective phase is now expected before continuation.
📐 Additional Confluence: Fib Speed Fan
The 0.618 Fib Speed Fan — drawn from the all-time high at $295.83 to the swing low at $95.26 — aligns perfectly with this resistance zone, adding more weight to the idea of a potential rejection or pause.
🟢 Long Setup: The Next High-Probability Entry Zone
We now shift our focus to where the next long opportunity could arise. Here’s the technical confluence:
Anchored VWAP from the recent low at $141.41 sits at $164.70
4H bullish order block around $164.46
0.382 Fib retracement of the full 5-wave impulse: $165.42
0.412 Fib retracement: $164.25
All these levels converge in a tight band, providing a solid long entry zone between:
Long Entry Zone: $165.50 to $164.25
Stop-Loss: Below $160 (to protect against any deep wick)
Targets:
TP1: $171.75 (Point of Control from the range)
TP2: $180.00 (resistance retest)
TP3: $200.00 (psychological level)
Estimated R:R: ~6:1 — High-conviction setup
Bonus: If price returns to this $165 zone within 24 hours, it will also be supported by the 0.618 Speed Fan — adding one more layer of support.
🔴 Short Setup: Reversal Play at $200
For those watching from the sidelines or looking to fade the rally, the psychological level at $200 presents a strong short opportunity — but only on confirmation (e.g., SFP or bearish engulfing).
Short Entry: On rejection at $200
Stop-Loss: $206.10
Target: $187.00
Estimated R:R: ~2:1
🧠 Summary:
Completed 5-wave structure → potential correction phase underway
Strong resistance at $175–$183 with SFP and speed fan alignment
High-probability long setup at $165.5–$164.25 with multi-layered confluence
Potential short at $200 on confirmation
⚠️ Key Takeaway: Don’t Chase the Highs
This is where many traders slip — FOMOing into trades at major resistance. Please, don’t do it. Instead, wait for:
A pullback into well-defined support (like the $165 zone), or
A clean breakout above $180, followed by a confirmed retest
____________________________________
If you found this helpful, leave a like and comment below! Got requests for the next technical analysis? Let me know.

Solana Builds Bullish Case – Targeting $170 With 17% UpsideHello and greetings to all the crypto enthusiasts, ✌
All previous targets were nailed ✅! Now, let’s dive into a full analysis of the upcoming price potential for Solana 🔍📈.
Solana is showing strong accumulation within a tight range, with increasing volume suggesting strategic positioning by larger players. Price action is approaching a critical support zone, adding confluence to the bullish bias. A potential upside of at least 17% is in play, with the primary target set at $170. 📈
🧨 Our team's main opinion is: 🧨
Solana is consolidating near key support with strong whale activity—looking for at least **17% upside** toward the **\$170** target. 🚀
Give me some energy !!
✨We invest hours crafting valuable ideas, and your support means everything—feel free to ask questions in the comments! 😊💬
Cheers, Mad Whale. 🐋

SOLUSDT Reversal Brewing — Watch This Level or Get Wrecked!Yello Paradisers — Are you paying attention to #SOLUSDT? Because what’s forming right now isn’t just noise — it’s a high-probability reversal setup that could trap the late bulls or become the kind of move that sets the tone for the next few weeks. Either way, the next play is going to separate professionals from gamblers. Let’s talk.
💎#SOLUSDT has been printing textbook bearish price action for weeks — lower lows and lower highs on the major time frame. But something critical has just changed. A break in market structure has occurred, and we’ve now got a higher high. That’s your first probable signal that the tide may be turning. Now comes the most important test — can we form the higher low to confirm this shift?
💎What makes this setup even more interesting is that we’re not just seeing a random bounce. SOL is in the middle of potentially probable completing two major bullish reversal patterns — an inverse head and shoulders and a Quasimodo. The left shoulder and neckline are already locked in. The right shoulder? Still cooking. But here’s the thing — the previous resistance, which aligns perfectly with where the right shoulder could form, is lining up as a textbook retest zone. That means we could get the higher low right there, completing both patterns at once.
💎Right now, price is struggling against multi-timeframe resistance, and that’s exactly what we want. It increases the probability of a short-term pullback to the key zone — around 110.9 to 115 — before the real breakout happens. If that level holds, and we print a confirmed higher low, this whole setup becomes explosive.
💎First area of resistance sits at 153, but that’s just the appetizer. The main zone we’re looking at is 173 to 181. That’s the bigger move that this structure is potentially building toward. But let’s be clear — if SOLUSDT closes a candle below 110.9, the entire setup gets invalidated. That level is your line in the sand.
This is the kind of setup we live for — clean structure, clear invalidation, and serious upside potential. But don’t rush it. The market will reward the ones who wait, not those who chase. Let others panic. Let others fomo. You focus on execution.
Trade smart, Paradisers — and always remember, only a few will catch the real move. Be one of them.
MyCryptoParadise
iFeel the success🌴

Solana Bullish Continuation Points To $418-$617 Next ATH TargetAll the loses incurred since late February have been recovered, Solana is now green. The action today is a full green candle as a continuation of the recovery that started 7-April. This date marked the end of the correction and also the start of the 2025 bull market cycle, period, phase and wave.
Solana is going up and set to grow long-term.
It is good. Nothing can stop what is happening from happening.
Nothing can stop the 2025 Cryptocurrency bull market. This is a major global event.
Cryptocurrency is the future of money, the present of money and is here to stay.
Solana is one of the top projects with a huge market capitalization and a thriving ecosystem; we want more.
Solana is ready now, bullish now, ready for the next target, let me tell you about those.
1) Easy target $195 will be hit first within days. This one is too easy so you can ignore and continue to hold.
2) Easy target $218 and we are growing nicely.
3) $252 is the first resistance on the way up. This resistance will be broken easily and the ATH challenged before additional/maximum growth.
4) Once the ATH gets conquered, everything will turn pretty good. Solana will enter the "price discovery phase." The first stop above the All-Time High is $418, followed by additional growth for sure. Cryptocurrency will do awesome in late 2025. You read this here first.
5) The main target for this bullish wave will be $617. This is a place where one can take profits but you should still expect additional growth.
The bull market will be long and strong. The bear market will be weak and short.
This dynamic will be present for an entire decade, as the world adapts to Cryptocurrencies and adopt them as the default means to exchange value. New money baby! Virtual money. Digital money. Technology money. A new generation. Prosperity, freedom and growth. That's Crypto.
Thanks a lot for your continued support.
Namaste.

SOL - Strong Structure Rejected!Hello TradingView Family / Fellow Traders! This is Richard, also known as theSignalyst.
The picture says it all!
📈As long as the $134 structure marked in red holds, I will be expecting a bullish continuation towards the $180 resistance level.
📚 Reminder:
Always stick to your trading plan — entry, risk management, and trade management are key.
Good luck, and happy trading!
All Strategies Are Good, If Managed Properly!
~Rich

SOL Bullish Pendant 2025-05-06 Daily ChartSOL has formed a Bullish Pendant on the Daily Chart: 2025-05-06

DeGRAM | SOLUSD Held the $145 level📊 Technical Analysis
● SOL broke above the long-term descending resistance near $130 and held it on a retest, confirming a bullish reversal.
● A consolidative range between $145 support and $154 supply has formed; a decisive break above $154 targets the rising-channel top near $160.
💡 Fundamental Analysis
● SOL staking volume recently surpassed Ethereum’s, underlining robust on-chain yield demand.
● DeFi Development Corp filed to offer $1 billion in securities to boost SOL holdings, signaling institutional accumulation.
✨ Summary
Resistance-turned-support at $145, strong staking growth, and corporate demand support a short-term long bias: targets $154 → $160; invalidation below $140.
-------------------
Share your opinion in the comments and support the idea with a like. Thanks for your support!

SOL-Long planCurrently at S/R ~180. Either we break past today or post-CPI or we get a little whipsaw around CPI for which setting bids at 12H OB marked (yellow box) is a good idea. Either way, midterm target remains at $256, hopefully sometime in June.

SOL LIVE TRADEHello dears
Given the price support by buyers and the formation of higher ceilings and floors, we can open a trade with risk and capital management.
*Trade safely with us*

Solana SOL price analysisToday, a press release was published that CRYPTOCAP:SOL Strategies (aka MicroStrategy from the world of #Solana) bought another 122,524 CRYPTOCAP:SOL at $149
Earlier, the company said it would sell $500mn in convertible bonds, to buy #Solana, which capitalized now is at $74bn
Well, if you look at the OKX:SOLUSDT chart, we can say that it would be good to keep the price above $107-115, above the trendline, which has been going on since the beginning of 2023.
Once this condition is met, we can start dreaming again about the start of a super march of the #SOLUSD price to $790 in 2025.
_____________________
Did you like our analysis? Leave a comment, like, and follow to get more

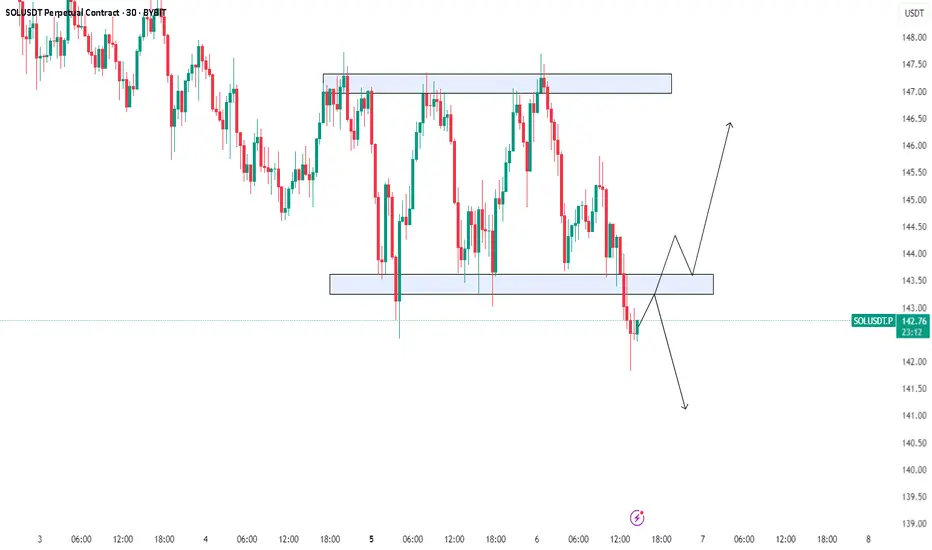
SOL/USDT downtrend continuation or just a fakeout?The price was in a strong downtrend but started to range...where the price did not break either side...but now its broke trought the bottom support and we now need to wait for confirmation if the price will bounce off down or break back in to range and bounce to the upper ressistance level.
SOLANAMy Trade Plan: Waiting for the $165 Liquidity Tap
I’m locked in on the 2-hour chart, hunting for a high-probability long setup at $165, where a key demand zone aligns with recent liquidity pools. This level has acted as support in April and May 2025, soaking up buy orders before reversals. I’m waiting for SOL to tap $165 (ideally with a bullish candle like a hammer or engulfing pattern) and then confirm a break of structure (BOS) by taking out the recent 2H higher high at $182. This would signal a new bullish impulse wave.
For risk management , I’m placing my stop loss just below the closest liquidity level at $161, a zone where stop hunts often occur before reversals, as seen in CoinGlass liquidation data. My target? The next resistance at $195 (a 17.6% move) or even $220 (33.3% upside) if SOL breaks out of its current bull flag pattern, as noted by analysts on TradingView. I’ll trail my stop using a 1.5x ATR (currently ~$3.50) to lock in profits if the move runs.
Why the Hype?
Solana’s fundamentals are screaming bullish. Over $450M in assets were bridged to Solana in April 2025, with $300M from Ethereum, boosting DeFi activity. SOL’s DEX volume hit $3.32B daily, grabbing a 28.99% market share among blockchains, per DefiLlama. Stablecoin supply on Solana exploded by 156% in 2025, surpassing GETTEX:13B , with USDC dominating. Add in projects like Sanctum (up 44% in deposits) and Jito’s liquid staking, and SOL’s ecosystem is a rocket ship. Despite past outages, upgrades like QUIC and stake-weighted QoS have kept the network humming.
Final Thoughts
Solana’s bullish structure and ecosystem growth make it a top-tier altcoin, but I’m not chasing this pump. I’m waiting for that $165 tap and a break of structure above $182 to confirm my long entry—patience is my edge! Crypto trading is a wild west showdown—volatility can crush you. Always use tight risk management, set stop losses, and do your own analysis before pulling the trigger. Let’s catch this wave, but only when the stars align!

Financial Markets Are Not Known for Their CharityFinancial markets are not charitable institutions—they operate on risk, speculation, and the push and pull of supply and demand. Many retail investors learned this the hard way.
Last November, retail investors rushed in at market highs, driven by optimism and FOMO. Now, many are clinging to their high entry points, hoping for a break-even price—even though some would need at least a 5x return just to get back to entry price one . The market, however, does not move according to people’s wishes.
Some retails are holding on, hoping to break even, but the reality is that they may never see those initial values again. Others, especially those with small wallets , are chasing big wins—sometimes looking for a 10x return—which often leads to deeper losses.
Remember this : " Financial Markets Are Not Known for Their Charity " .
BINANCE:ETHUSD BINANCE:XRPUSDT BINANCE:DOGEUSDT BINANCE:SUIUSDT


Solana 1-Day Chart – Are We on the Brink of a $1,000 MOONSHOT?!Solana is absolutely on fire! On this 1-day chart, we’re witnessing a massive rising channel that’s been building since 2023. After a solid rebound from the $93 support, Solana has smashed through a fractal resistance line (check that arched arrow from mid-2023 to early 2024 top) . Now, it’s breaking out at a parallel resistance, hanging around $174 — and this could be the setup for a MASSIVE move upward!
I’m calling a potential target of $1,000 if SOLUSDT can muscle through the big resistances ahead: $200, the ATH at $270, and everything beyond. This breakout screams opportunity — Solana might just catch another wave of demand and go parabolic! The $93 support (marked "Back to Nothing Below This Line") looks rock-solid, giving us a strong foundation for this rally.
Key Levels to Watch:
Support: $93 (channel base)
Current Price: $174 (breakout zone)
Resistances: $200, $270 (ATH)
Target: $1,000 (if momentum holds)
Are you ready for this? I’m buzzing — I can’t believe this might actually happen!
Let’s hear your thoughts, traders! Are we heading to $1,000, or will resistance hold us back?

Solana (SOL): Gameplan Remains The Same | Aiming at $100 Solana's game gameplan has not changed for us, where we are still looking for that downward movement to form a proper support zone near the psychological area at $100.
More in-depth info is in the video—enjoy!
Swallow Academy

SOLUSDT – Bullish Flag Below 200 EMA | Breakout Coming?SOL broke out of the bearish trendline and flipped to a bullish structure. Since then, a bullish flag has formed in the daily timeframe.
The price is now just below the 200 EMA, which is acting as resistance. A clean breakout above this level could trigger the next leg up.
Dynamic EMA Crossing Indicator– which flashed a Buy signal recently, giving more confidence to the bullish setup.
If the flag breaks out and the price clears the 200 EMA, the next target is around the 180 zone (resistance).

SOL/USDT DAILY CANDLESOL/USDT
A bullish trend of daily candles has been ongoing for 13 candles and will end if 5 bearish candles form when the 13 candles are fulfilled.

HolderStat┆SOLUSD fixed above the trend lineSOL spent March in a messy consolidation box before rotating into a disciplined rising channel that has marched price from 110 to the doorstep of 180. Bulls are now wrestling with that major horizontal barrier; acceptance above it would turn the former ceiling into fresh support and open the calculated channel extension toward 205. Until channel lows around 150 give way, trend traders may lean on pullbacks inside the lane to stay positioned with momentum. 🔥

You lost the profit..If you are left with a profit from Solana, wait for a correction from the selected area.
In case of correction, the appropriate areas for buying are indicated.
You can buy in steps, I will also tell you the areas for selling in profit in the next posts.

SOL/USDT – Bullish Market Structure Shift with Clean Targets AheSolana has shown a clear change of character (CHOCH) followed by a break of structure (BOS) on the 4H timeframe, indicating a strong bullish reversal. After forming a series of bearish BOS during the downtrend, the recent structural shift suggests buyers have stepped in.
📌 Key Highlights:
Clear CHOCH confirming trend reversal
Recent BOS signals bullish continuation
Price reclaiming demand zone and flipping structure
Targeting major supply area near $240–$250
Ideal RR setup with stop below recent structure and target into inefficiency/liquidity zone
If price holds above the recent breakout zone, we could see a strong continuation toward previous highs. Watch for minor pullbacks to validate entry opportunities.
