#SOL/USDT Analysis📊 #SOL/USDT Analysis 📊
📉 CRYPTOCAP:SOL is currently testing the Daily Bearish IFVG zone.
🔹 I'm expecting a Buy-side Liquidity Grab first before entering any short positions — there's also a Bearish OB sitting right above as confluence.
🔻 Major Support: PMH $112
SOLUSDT trade ideas

SOLWhile SOLANA is vastly choppy in the recent days, this idea is the closest I could get with an accurate trade. Y ou can see huge resistance with stored SSL which will likely get sweeped in the coming days as well as potentially fill the untapped breaker laying around the 140s zone as seen on the chart. Take profits as you find comfortable

SOLUSDT – Final Ascent Before the Abyss?"If this isn’t a trap, then FTX is still solvent."
📈 THE SCENE:
Solana’s looking bullish? Sure. So did Luna, Celsius, and Three Arrows before they became bedtime horror stories.
Price: Hovering around $134.5, acting like it’s immune to gravity.
VPVR: Volume cliff right below — there’s literally nothing until $128… then $118.
POC: $132.8 — aka the spot where poor souls entered late, juiced on hopium and influencer tweets.
🧠 THE DATA (a.k.a. The Smoking Gun):
OI climbing like it’s 2021, but without the bull market to back it.
Delta positive, yet price stagnant = buyers getting absorbed harder than WeWork’s liquidity.
Volume slowing = momentum fading = perfect setup for smart money to yank the rug.
📉 MACRO PERSPECTIVE (4H):
What do we see?
Long buildup without follow-through.
Price crawling up while BTC is on thin ice.
If Bitcoin sneezes, SOL's lungs collapse.
BTC below $84K = SOL going back to $120s faster than CZ deletes a tweet.
🎯 TRADE IDEA:
Short from $134.5–135.5
SL: $137.2 (because we respect market makers' yacht fund)
TP1: $128
TP2: $118
Leverage? Whatever makes your palms sweat and your broker call your therapist.
💬 FINAL WORDS:
“This rally feels about as real as Elizabeth Holmes’ biotech vision.
Everyone’s long. Everyone’s confident. Everyone’s... about to get margin called.”
Smart money isn’t buying this. They’re selling it... to you.
And when they dump, it’s not a correction — it’s a funeral procession with fireworks.

SOL - Some new TA- IO and CVD increased regarding last highs (15.04.) but price has not broken Local Daily line. This means Big Money is shorting the Local Daily and absorbing Longs.
- Price is going up while Volume (OBV and AD) is decreasing in almost every time frame. Again. Big money is selling heavily to the Longs. The probability that Whale Sellers get exhausted is high too!
- 1H:
Grey line would be a nice Short if we can catch it.
Price on 0.78 Fib.
Risky...
1H Chart :
Follow for more ideas/Signals.💲
Just donate some of your profit to Animal rights or other charity :)✌️

[SOL] 2025.04.16One of the key highlights at this current cycle low is the precise overlap between the PRZ (Potential Reversal Zone) of a Shark pattern and the termination point of the Elliott Wave’s fifth wave.
This confluence provides a strong technical foundation for a potential rebound—not just a short-term relief rally, but the beginning of a medium- to long-term wave reversal.
In the case of the Shark pattern, applying Fibonacci ratios from the B wave’s start to its endpoint reveals an ideal PRZ at the 1.13 extension level.
This 1.13 zone is historically known as a powerful reversal area within Shark patterns, and previous examples support its high-probability bounce potential.
Simultaneously, within the same price region, the Elliott Wave count also completes its fifth wave structure.
Upon closer examination, the full 1–5 wave sequence is clearly distinguishable, and the final fifth wave is characterized by decreasing volume and a sharp price drop—hallmarks of a classic terminal wave.
The fact that both technical elements converge in the same zone—followed by an actual upward reaction—strongly suggests that this rebound is structurally justified, not coincidental.
Thus, this zone presents a technically valid entry point for short- to mid-term positions.
We project potential upside targets based on Fibonacci retracement levels:
First target at the 0.382 retracement, around 173.19,
Second target at the 0.618 retracement, around 219.87.
In conclusion, the overlap between the Shark 1.13 PRZ and the Elliott Wave’s fifth-wave termination builds a highly compelling reversal scenario from a technical standpoint.
The current upward movement is well-grounded in this structure and should be interpreted as a forecastable shift, not an anomaly.

Solana Bullish Based On Volume & Support, Or Crash?Solana is now bullish, I shall explain. Many signals are pointing to this fact, these are easy to see. Once I share them here, below, you will agree with me 100%. Correct?
Let's start with the easy part. Volume is rising and has been very strong lately. A significant rise in trading volume after a major drop and as prices grow is a signal that confirms any bullish development. The bullish development is the move and recovery above support.
Support is found as the 0.148 Fib. extension level, Solana trades above it. Support is the early August 2024 low. SOLUSDT trades above it. Support is EMA34, Solana closed daily above this level after resistance was met. Support found, bullish.
The RSI is bullish with a reading of 55. A bottom formation is present, v shaped pattern. Do you want more?
One signal is good but not enough. Two signals are good but we need more. Three signals can count toward reaching certain conclusions about what will happen next. When you have 5, 6, 7 strong signals all combined, it is hard to miss what the chart has to say. Too many signals now are pointing toward higher prices. Do you see any bearish signals?
You can say bearish only if you ignore the bullish signals.
Or you can say bearish if you don't have a chart.
If you are with me now —thanks for the support— you already know that Solana is set to grow.
Solana will soon trade above $400. Very easy, I know you agree with me because I showed you data to support my point of view. It is not done blindly. Everything I wrote can be confirmed by anyone, at any point in time. Now.
You can check each signal for yourself; what do you see?
I see a low 7-April followed by a quick recovery. I see the market now turning green.
Do you agree?
If you do, follow me.
Namaste.

SOLUSDTWe can attempt to buy SOLUSDT from specified level if it break trendline , also there is bullish divergence occur indicate that it moves upward.

Solana (SOL) Market Overview – April 17, 2025As of April 17, 2025, Solana (SOL) is trading at approximately $134.55 USD, reflecting a 5.48% increase from the previous close.
⸻
📈 Technical Analysis
Price Action & Momentum:
• Recent Performance: SOL has rebounded from lows near $120 to around $134.55, positioning itself as one of the top-performing altcoins recently.
• Support & Resistance Levels:
• Immediate Support: $120 – Crucial for sustaining the current bullish momentum.
• Resistance Zone: $133 – $135 – A breakout above this range could unlock further upside.
Key Indicators:
• RSI: 53.90 – Neutral momentum
• MACD: -3.01 – Slightly bearish
• Stochastic Oscillator: 92.14 – Overbought territory
• ADX: 19.10 – Weak trend strength
⸻
🧭 Fundamental Analysis
Network Strength:
• High Throughput & Low Fees: Solana continues to dominate with its scalable and low-cost blockchain infrastructure.
Institutional Interest:
• ETF Activity: Five ETF filings as of March 2025 highlight increased institutional trust in Solana.
Market Sentiment:
• Fear & Greed Index: 29 – Market is in “Fear” zone, potentially creating long-term buying opportunities.
⸻
🔍 Summary
Solana is showing bullish recovery signs driven by positive price action and ETF momentum. However, technicals suggest a cautious approach in the short term due to overbought signals and weak trend strength. Fundamentally, Solana’s powerful infrastructure and institutional support could fuel long-term growth.

Elliott Wave Update – Structure OverviewBINANCE:SOLUSDT
We may have found a potential local bottom at yellow Wave A, and are now tracking a move towards yellow Wave B.
This yellow Wave B appears to be unfolding as a 1-2-3-4-5 structure:
Waves 1-2-3 are likely completed.
Waves 4 and 5 could still be ahead.
This full impulse may form part of a larger A-B-C correction, completing the final yellow Wave B.
In the black wave count, the 1-2-3 move is finished.
Within Wave 3, we saw a clean internal 1-2-3-4-5, confirming the completion of that wave.
Currently, I’m tracking the move from black Wave 3 to black Wave 4 as a developing A-B-C correction:
Wave A is potentially in.
We are now in the resistance zone of Wave B, which could lead to the final drop into Wave C.
After completing Wave 4, I expect an upward move into black Wave 5, starting with an initial A-wave.
This should then form another A-B-C structure, leading to the completion of the final yellow Wave B.

SOLUSDT Monthly Chart Analysis Review:📢 TradingView Publish Template (in English):
Title:
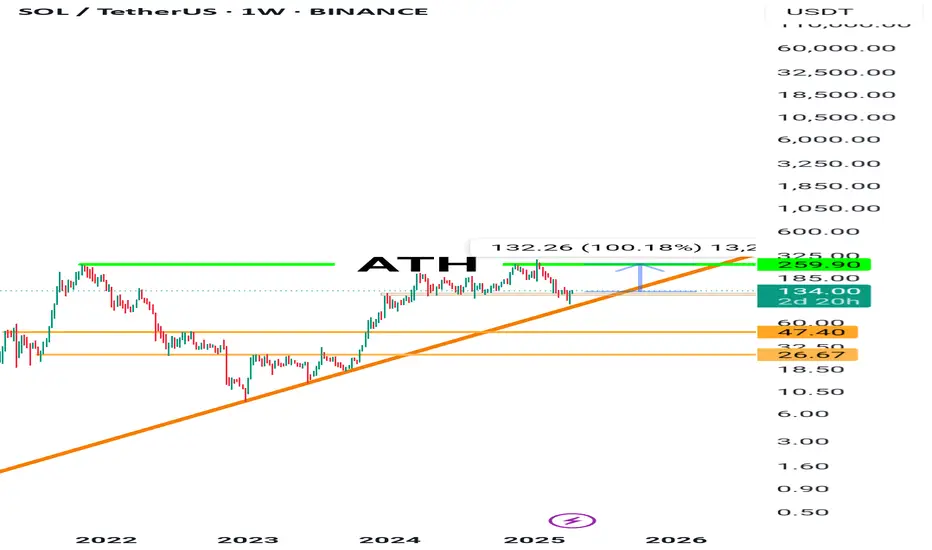
🚀 SOLUSDT Monthly | Long-Term Accumulation to $478? | 10:1 R/R Setup
Description (English):
SOLANA is forming a strong higher low on the monthly chart and currently sitting around the 0.382 Fibonacci retracement zone (~$135).
✅ Entry Zone: $130–140
🔻 Stop Loss: $98 (below the last support)
🎯 Take Profit 1: $295
🎯 Take Profit 2: $478 (1.618 Fib Extension)
💎 Long-term structure remains bullish as the asset consolidates above key support. This is a high reward / calculated risk setup with a potential 10:1 Risk-to-Reward ratio.
🚨 As always, manage risk and use proper position sizing. Not financial advice – for educational purposes only.

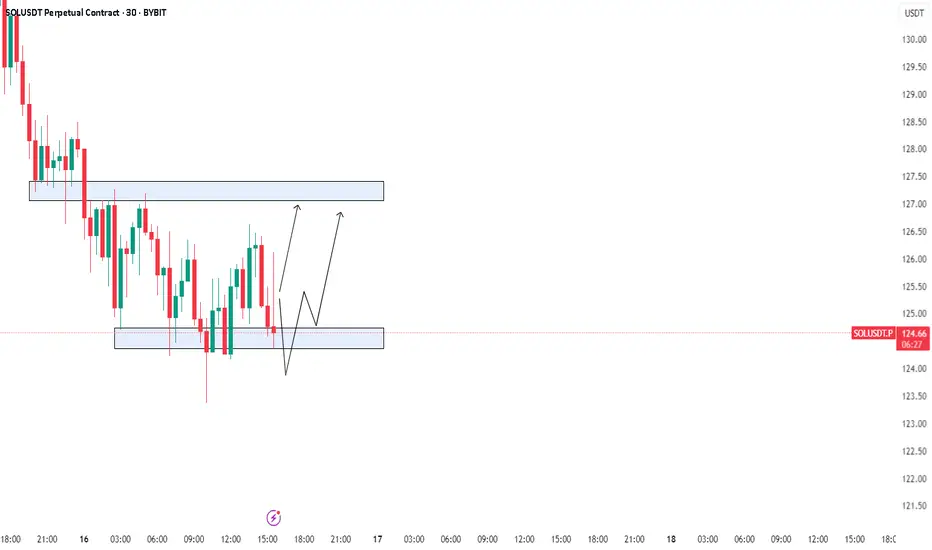
SOL – Small pullback to then grab the liquidity?This 1H chart of SOLUSDT on Bybit showcases a clean bullish continuation setup after a strong impulsive move upward. The current price action suggests a strategic retracement into a high-probability zone of interest before a potential continuation toward buy-side liquidity.
---
1. Market Structure & Context:
- SOL has shifted market structure to the upside following a strong impulse that broke previous lower highs.
- The current pullback resembles a classic bullish retracement, aligning with smart money concepts where price revisits inefficiencies and discount zones before continuation.
- The low on the retracement appears to be forming a higher low relative to the previous structure.
---
2. Fair Value Gap (FVG) + Golden Pocket Zone:
- The blue box represents a clear Fair Value Gap created during the recent rally — a price imbalance often targeted for entries by institutions.
- Overlaying that zone is the Fibonacci golden pocket (0.618–0.65), a highly reactive retracement area in bullish moves.
- The confluence of FVG and the golden pocket makes this a powerful demand zone, supported by historical order flow behavior.
---
3. Fibonacci Levels & Price Action:
- 0.618–0.65 zone: Ideal entry region during bullish retracements. Price is currently reacting within this band.
- 0.786 level: A deeper retracement level that still supports bullish continuation if respected — though it marks the edge of the current FVG.
- The equilibrium between these levels represents a discount area for accumulation.
---
4. Liquidity Outlook – Buy-Side Liquidity (BSL):
- A clear BSL (Buy-Side Liquidity) sits above the previous local high.
- Price is likely to target this level as the next point of liquidity collection once the retracement completes.
- The green arrowed path shows the anticipated flow: a short-term dip into the FVG before a bullish move to sweep the BSL.
---
5. Trade Narrative:
- This setup reflects an entry based on optimal trade theory — retracement into a zone of inefficiency and discount (FVG + golden pocket).
- Bullish continuation is expected if this zone holds, especially with confluence from market structure and resting liquidity overhead.
- Ideal confirmation may involve lower timeframe bullish breaks of structure inside the FVG.
---
Summary:
SOL is offering a textbook retracement setup on the 1H, with price pulling back into a confluence of a Fair Value Gap and golden pocket (0.618–0.65). If the zone is respected, the next likely destination is the buy-side liquidity resting above previous highs. The reaction within this area will be key to validating the bullish scenario.

Trading opportunity for SOLUSDTBased on technical factors there is a Sell position in :
📊 SOLUSDT
🔴 Sell Now
🪫Stop loss 151.00
🔋Target 97.00
📏 R/R 2
💸RISK : 1%
We hope it is profitable for you ❤️
Please support our activity with your likes👍 and comments📝

Solana (SOL): Re-Testing Resistance Zone | Sell Opportunity!Solana has reached the major resistance zone where it is retesting the recently broken zone, which will determine the next bigger movement of the coin. We are seeking to see an MSB to fulfill properly, which can lead the price to dip another 22%.
More in-depth info is in the video—enjoy!
Swallow Academy

SOLUSDT – Ready for Liftoff? Bull Flag Breakout in Progress!!🚀 SOL Ready for Liftoff? 🌕
SOL just broke out of a beautiful falling wedge on the daily timeframe — a classic bullish reversal pattern 🕊️
📈 After months of downtrend, we’re now seeing early signs of structure flipping and price reclaiming key zones.
Here’s my bullish roadmap:
🔹 First Target Zone: $180 (testing previous support turned resistance)
🔹 Second Target: $220 (mid-range liquidity grab)
🔹 Final Destination (Q2/Q3): $272 🏁
Support Levels to Watch 🛡️
📍 Current structure holding near $130
📍 Second support around $180
📍 Third support flip near $260 – key for sustained rally
💡 Why I'm Bullish:
✅ Breakout from wedge pattern
✅ Strong support base
✅ Higher lows forming
✅ Volume beginning to build 📊
✅ Momentum indicators turning up (MACD crossover on watch) 🔍
🔥 The rocket is fueling up — let’s see if SOL can fly past resistance and make it to the moon 🌕
#SOL #Solana #BreakoutSetup #Bullmaster #CryptoTrading #Altseason #RocketFuel #TechnicalAnalysis 🚀📈

SOLANA I Monthly CLS I KL - OB I Model 1 , Target 50% than CLSHey, Market Warriors, here is another outlook on this instrument
If you’ve been following me, you already know every setup you see is built around a CLS range, a Key Level, Liquidity and a specific execution model.
If you haven't followed me yet, start now.
My trading system is completely mechanical — designed to remove emotions, opinions, and impulsive decisions. No messy diagonal lines. No random drawings. Just clarity, structure, and execution.
🧩 What is CLS?
CLS is real smart money — the combined power of major investment banks and central banks moving over 6.5 trillion dollars a day. Understanding their operations is key to markets.
✅ Understanding the behaviour of CLS allows you to position yourself with the giants during the market manipulations — leading to buying lows and selling highs - cleaner entries, clearer exits, and consistent profits.
🛡️ Models 1 and 2:
From my posts, you can learn two core execution models.
They are the backbone of how I trade and how my students are trained.
📍 Model 1
is right after the manipulation of the CLS candle when CIOD occurs, and we are targeting 50% of the CLS range. H4 CLS ranges supported by HTF go straight to the opposing range.
📍 Model 2
occurs in the specific market sequence when CLS smart money needs to re-accumulate more positions, and we are looking to find a key level around 61.8 fib retracement and target the opposing side of the range.
👍 Hit like if you find this analysis helpful, and don't hesitate to comment with your opinions, charts or any questions.
⚔️ Listen Carefully:
Analysis is not trading. Right now, this platform is full of gurus" trying to sell you dreams based on analysis with arrows while they don't even have the skill to trade themselves.
If you’re ever thinking about buying a Trading Course or Signals from anyone. Always demand a verified track record. It takes less than five minutes to connect 3rd third-party verification tool and link to the widget to his signature.
"Adapt what is useful, reject what is useless, and add what is specifically your own."
— David Perk aka Dave FX Hunter ⚔️

DeGRAM | SOLUSD Testing the Demand Zone📊 Technical Analysis
Support and Uptrend
SOL/USDT has formed higher lows along the uptrend line and is now testing the $120-125 support area.
Resistance area
Key resistance is at $135; a breakout could trigger an acceleration of the upside.
Outlook Scenario
Price may retest the $135 level in the near term, with bullish momentum strengthening.
💡 Fundamental Analysis
Solana is gaining momentum thanks to growing DeFi volume and high developer activity, which boosts investor confidence.
✨ Summary
Technical and fundamental signals coincide - watch $135 for breakout confirmation.
-------------------
Share your opinion in the comments and support the idea with a like. Thanks for your support!

Give me some energy !!!The price has broken the wedge, and in my opinion, it could form a head and shoulders pattern before experiencing significant growth.
Give me some energy !!
✨We spend hours finding potential opportunities and writing useful ideas, we would be happy if you support us.
Best regards CobraVanguard.💚
_ _ _ _ __ _ _ _ _ _ _ _ _ _ _ _ _ _ _ _ _ _ _ _ _ _ _ _ _ _ _ _
✅Thank you, and for more ideas, hit ❤️Like❤️ and 🌟Follow🌟!
⚠️Things can change...
The markets are always changing and even with all these signals, the market changes tend to be strong and fast!!

SOLANA back above support. SOL is back above horizontal support. After a stop hunt, the manipulation is likely over. If the price can make a higher high here we start to build a choch of the structure. Momentum and trend oscillators are also in confluence.
Full TA: Link in the BIO

Solana (SOL): Might Catch a Good Small Short Here.Solana is looking good for short as soon as we will see a local zone to be broken and secured by sellers!
More in-depth info is in the video—enjoy!
Swallow Team

Solana (SOL): Possible Quick Liquidity Grab To 200EMAWe are seeing some bullish volume to build near the local support zone where we might see similar movement like we did on the 2nd of March on the SOL coin.
We are waiting here for our entry (where we should see a break of structure) to form, which then would give us a good upward movement of 8% to catch!
Swallow Team

SOL/USDT Ranging and ranging...The price is overall in sell trend and since the candle here made a big wick to the upside theres a chance of another fakeout....now i dont believe the market will just turn around but i am sure that since its a sell range that its possible it will come back for another touch to the upside sooner or later.
SOL throwback short setup formingShort Entry : 133
TP : 122
SL : 136.5
My trading is based on momentum, and the chart said that SOL is going to retest the previous 4H breakout resistance.
