SOL in descending channel ready for jump 28% gain toward 170$Hi the support and resistances on the chart are based on the previous data and weekly candlesticks if BINANCE:SOLUSDT holds this last support the potential of 28% gain is logical toward 170$
Trade ideas

Lingrid | SOLUSDT Initial Major Resistance Zone After Price DropBINANCE:SOLUSDT is climbing toward the 150–155 resistance cluster, where the downward channel’s trendline, horizontal supply, and the local upward trendline all converge. Despite the recent bounce, the broader structure remains bearish, with multiple lower highs and no confirmed reversal—suggesting the move up is more corrective than structural. The compression seen before the breakout and the sharp recovery both reflect liquidity-driven retracements rather than a trend change.
If price stalls at this confluence zone, sellers may regain control and drive the market back toward 133, followed by the deeper support pocket, which aligns with the mid-channel and the established buying area. Until CRYPTOCAP:SOL breaks and sustains above the channel, bullish continuation remains unconfirmed.
➡️ Primary scenario: rejection from 150–155 → continuation toward 133.
⚠️ Risk scenario: a clean break and close above 155 invalidates the short thesis.
If this idea resonates with you or you have your own opinion, traders, hit the comments. I’m excited to read your thoughts!

SOL bullish flagSOL has formed a bullish flag, the movement is still within the pattern
Liquidity has formed at the upper level, which the price is more likely to reach
At the bottom of the pattern, an upward movement is observed, as each subsequent bottom is higher than the previous one
Full breakdown with levels and graphs on the website

SOLUSDT Relief Rally into Supply Big Move ComingSOLUSDT has been grinding through a deep corrective phase since the January 2025 ATH. Wave A established the base, and price action is now developing the final leg of the structure. If the pattern completes fully, the extension could stretch toward the $80 zone before true recovery begins.
For now, the market is attempting a relief rally from the $123 support. Price is heading straight into a key supply block, and this zone will decide everything:
🔺 Break and hold above = bullish shift resumes
🔻 Rejection = deeper correction, wave C continues
This is the moment where trend direction becomes clear. Any breakout from this supply area will ignite strong momentum and could change the narrative completely. The structure remains clean, and volatility is building. The thread will be updated as the move develops.
Drop your thoughts below, are you watching the same zone?

DeGRAM | SOLUSD is preparing to reach the $160 level📊 Technical Analysis
● SOL rebounded sharply from the major support zone near 130, breaking the inner falling channel and signaling a shift in short-term structure. Price is now forming a bullish continuation pattern beneath dynamic resistance, with room to extend toward the 160 level once the breakout is confirmed.
● Prior triangle, consolidation, and flag formations all resolved downward but now price is rejecting lows more aggressively, indicating accumulation.
💡 Fundamental Analysis
● SOL benefits from rising network activity and renewed inflows into high-performance L1 ecosystems, while broader risk sentiment improves across crypto majors.
✨ Summary
● Bullish bias above 130. Targets: 150 → 160. Support: 130. Resistance: 160.
-------------------
Share your opinion in the comments and support the idea with a like. Thanks for your support!

SOLANA: Bullish Breakout Awaits Above 145SOLANA: Bullish Breakout Awaits Above 145
Solana is currently testing the upper boundary of its range-trading structure. A clean breakout above the 145 level would significantly increase the probability of a sustained bullish continuation.
For now, the price is still developing inside the pattern. However, with BTC showing signs of preparing for an upward move, SOLANA may follow the same bullish momentum in the near term.
If the price fails to break above 145, the corrective structure could extend, opening the possibility for a deeper pullback toward the 123 support zone before buyers attempt another push.
Key Upside Targets:
170
188
204
You may find more details in the chart!
Thank you and Good Luck!
❤️PS: Please support with a like or comment if you find this analysis useful for your trading day❤️

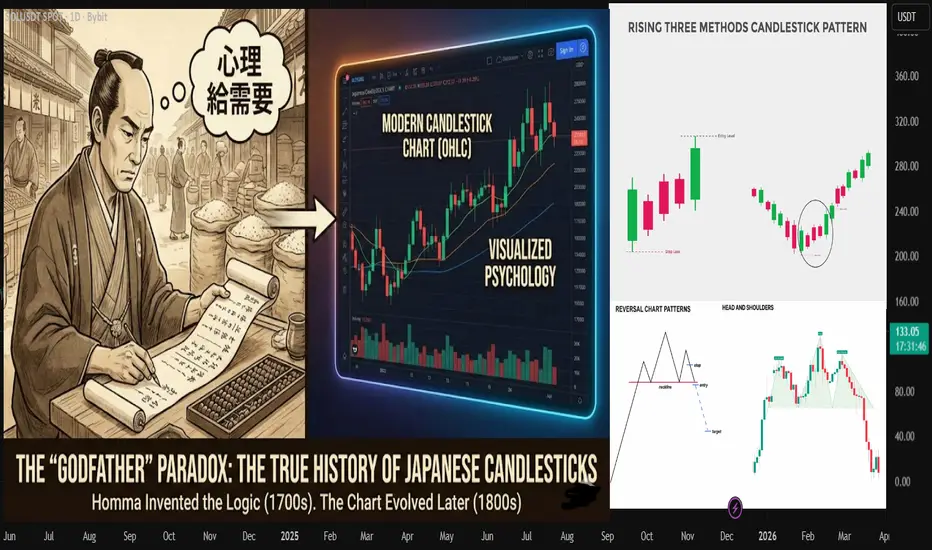
"Godfather" Paradox: The True History of Japanese CandlesticksIf you open any technical analysis textbook, you will likely find the same origin story: "Munehisa
Homma, a legendary rice trader in the 18th century, invented candlestick charts."
This is the most repeated "half-truth" in financial history.
While Munehisa Homma is indeed the "Godfather" of price action trading, he likely never drew a
candlestick in his life. The visual box-and-whisker charts we use today were developed nearly a
century later.
Why does this history lesson matter to your P&L? Because when you realize Homma wasn't
just drawing shapes, but defining market psychology, the patterns you see on your screen
suddenly make much more sense.
This article explores the true history of Japanese candlesticks, the critical distinction between
the "method" and the "chart," and how the ancient Sakata Rules still govern modern markets.
The "Software" vs. The "Hardware"
To understand where candlesticks actually came from, it helps to view technical analysis
through a computing analogy. We must distinguish between the visual tool and the underlying
logic.
1. The Hardware: The Modern Chart
The modern candlestick (with its distinct Open, High, Low, Close body and wicks) is a data
visualization tool. It colors the "body" to show direction and uses "wicks" to show rejection.
This specific visual format—the "hardware"—likely evolved during the Meiji Period (late 1800s),
long after Homma passed away. It was the result of generations of Japanese chartists refining
price data into a format that allowed for faster interpretation of momentum.
2. The Software: The Psychology
This is what Munehisa Homma actually invented. Trading in the Dojima Rice Exchange in
Osaka (the world's first futures market), he was the first to realize that price does not equal
value.
He identified that markets are driven by the emotions of fear and greed (Yin and Yang) and that
these emotions repeat in predictable cycles. Homma used primitive price notations, not modern
charts, but his genius was in the Sakata Rules (Sakata Goho)—a set of five methodologies
that describe the "market phases" caused by human emotion.
The Sakata Five Methods: Ancient Wisdom, Modern
Patterns
When Western traders finally imported candlesticks in the 1980s, they often focused on
single-candle signals (like the Doji or Hammer). However, Homma’s original system was built on
market structure and context.
Here are the original "Sakata Five Methods" and their modern equivalents:
1. San Zan (Three Mountains)
● The Concept: The market attempts to push prices higher three distinct times and fails.
The "mountains" represent the exhaustion of buyers.
● Modern Equivalent: Triple Top or Head and Shoulders.
● The Psychology: After a strong uptrend, the market becomes "heavy." It takes three
waves of buying to finally realize the supply is too strong to overcome.
2. San Sen (Three Rivers)
● The Concept: The inverse of the Three Mountains. The market tests a low price three
times, effectively drying up the selling pressure.
● Modern Equivalent: Triple Bottom or Inverted Head and Shoulders.
● The Psychology: This is not just a "support level"; it is a battle where bears exhaust
their ammunition (rice/shares) three times before bulls take control.
3. San Ku (Three Gaps)
● The Concept: "Ku" means empty space. Homma believed that if a market gaps violently
three times in the direction of the trend, the move is overextended.
● Modern Equivalent: Exhaustion Gaps.
● The Psychology: The first gap is news; the second is reaction; the third is hysteria.
Smart money sells into the hysteria of the third gap.
4. San Pei (Three Parallel Lines)
● The Concept: Three strong candles of similar size moving in one direction with very little
overlap.
● Modern Equivalent: Three White Soldiers (Bullish) or Three Black Crows (Bearish).
● The Psychology: Unlike the "Three Mountains" which shows stalling, this shows
momentum. It indicates a trend that has conviction and is likely to continue.
5. San Po (Three Methods)
● The Concept: A strong move, followed by a period of rest (small candles staying within
the previous candle's range), followed by a resumption of the move.
● Modern Equivalent: Rising/Falling Three Methods or Bull/Bear Flags.
● The Psychology: Homma recognized that markets cannot sprint forever. They must
breathe. A "rest" phase that doesn't reverse the trend is the most powerful signal to add
to a position.
The "Lost Century": Why Was This a Secret?
If these methods are so effective, why did the West only discover them in the 1980s? It wasn't
just a language barrier; it was a technological and cultural "perfect storm" that kept these
methods isolated in Japan for nearly 200 years.
1. The "Analog" Barrier (No Digital Charts) Before the PC revolution, Western "chartists"
were employees who drew charts by hand on graph paper. Switching to candlesticks wasn't a
simple software setting—it required retraining an entire workforce to draw boxes instead of
lines. The "Hardware" (Candlesticks) needed the "Software" (PCs) to finally go global.
2. The Guild Mentality In Feudal Japan, specific charting techniques were treated like martial
arts secrets. The Sakata Rules were not public domain; they were proprietary edges kept within
families or trading guilds to maintain dominance at the Dojima Rice Exchange.
3. The Conceptual Gap Western analysis (like Dow Theory) tried to be rigid and scientific.
Japanese analysis was built on military strategy and poetry (e.g., "Night Attack," "Abandoned
Baby"). It took analysts like Steve Nison to bridge the gap and explain that "Hanging Man"
wasn't a threat, but a specific reversal signal.
The Takeaway
When you turn on your TradingView charts today, you are looking at a 19th-century interface
running on 18th-century logic.
Don't just look for a "Shooting Star" in isolation. Look for the Sakata structure: Are we in a
"Three Mountain" exhaustion phase? Or a "Three Parallel" momentum phase?
Homma didn't leave us a drawing tool; he left us a map of human emotion.
- TuffyCalls (Team Mubite)
SOL-USDTIt was expected to have a correction after the growth it had, and now it is on its static support at $130 🕯📊
If it can maintain this level, the price could rotate and bounce back upwards 🚀💰
In case the correction continues, the next level will be at $124 ✔️🔼

$sol shortSOL failed to break structure to the upside and instead delivered a clean retracement into premium, rejecting right at the supply zone + Alligator alignment.
This is classic continuation orderflow.
1️⃣ Premium Retracement Complete
Price traded up into the bearish supply block (green zone)
aligned with the Alligator’s sell bias (bearish mouth formation).
Smart money sells inside this region → displacement follows.
2️⃣ Lower-Timeframe Breakdown Confirmed
A clean bearish break and retest formed after the tap:
• Trendline break
• Shift in micro-structure
• Weak reaction back down → showing no bullish strength
All confirm continuation lower.
3️⃣ Targets Below Remain Untouched
The next draw on liquidity sits at the 121.49 inefficiency/untapped zone.
Trade Idea – Short
Entry:
🔴 132.8 – 133.5 (supply zone retest)
Stop Loss:
⛔ 137.66
(above the supply block & invalidation)
Targets:
🎯 TP1: 127.00
🎯 TP2: 121.49 (main liquidity draw)
Model:
⚡ Bearish Continuation after Premium Retracement
Alligator confirmation
Supply rejection
Trendline break → retest

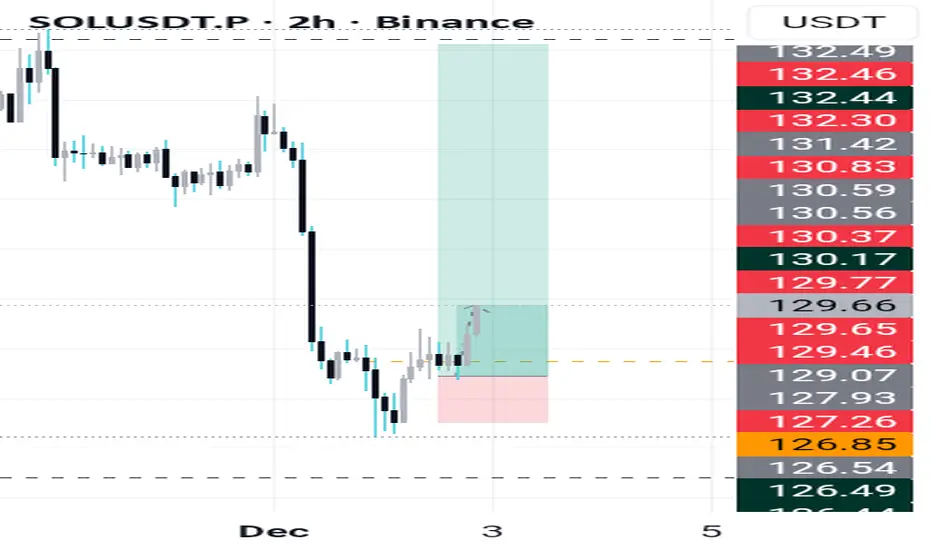
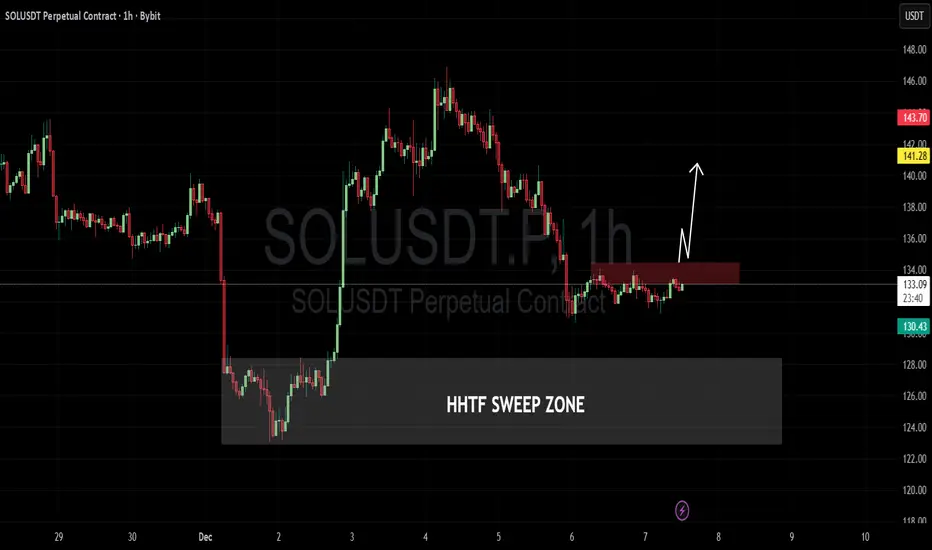
When sol does sol pumps ?The Plan:
Breakout: The price needs to close a 1-hour candle strongly above the Red Box (above ~134.50) to confirm that buyers have absorbed the selling pressure.
Retest (Flip): Ideally, price pulls back slightly to turn the previous resistance (Red Box) into support.
Expansion: Price continues upward toward the next liquidity targets.
The chart shows a potential bullish reversal, but it is currently at a decision point.
Aggressive Entry: Entering now anticipates the breakout but carries the risk of rejection at the Red Box.
Conservative Entry: Waiting for the candle close above 134.50 (as per the white arrow projection) offers higher confirmation but a slightly worse entry price.
The "HHTF Sweep Zone" provides a strong floor, giving this setup a defined risk-to-reward ratio if the breakout occurs.
Solana (SOL/USDT) – 4H Technical AnalysisSolana is currently consolidating within a tight range after failing to sustain momentum above the short-term moving averages. Price continues to trade below the 200-EMA, which keeps the broader 4H trend tilted to the bearish side.
Key Levels
Immediate Resistance:
$135–136 zone where price recently faced multiple rejections.
Short-term EMAs are also flattening near this region, creating additional overhead pressure.
Major Supply Zone:
$168–175 (highlighted red area).
This remains a strong higher-timeframe resistance where sellers previously dominated.
Immediate Support:
$128–130 (blue demand zone).
Price rebounded from here several times, showing active buyers.
Market Structure
Price attempted a short-lived recovery but failed to break above the 200-EMA. The market is forming lower highs, indicating weakening bullish attempts. Unless SOL makes a decisive close above the $135–136 region, upside continuation remains limited.
A sweep of liquidity into the $128–130 support zone is still possible, especially if momentum weakens further.
RSI Momentum
The RSI is hovering around the mid-zone (~45–47), reflecting indecision and lack of strong directional momentum.
No major bullish or bearish divergence is present on the current 4H structure.
As long as RSI remains below 50, bulls are not in clear control.
Possible Scenarios
Bullish Case
A clean breakout and 4H close above $136 could open room for a move toward $142–145, followed by a potential retest of the $155–160 region.
However, the 200-EMA overhead means buyers need strong volume to shift structure.
Bearish Case
If price breaks below the $128–130 demand zone, SOL may revisit $122–124, where the next support cluster is visible.
Failure to hold these levels could extend the corrective structure.
Neutral Summary
SOL is currently range-bound between $130–136, with neither side showing strong conviction. Traders may prefer waiting for a breakout from this range or a clearer reaction at the major support zone before taking directional positions.
This analysis is for educational purposes only and reflects general market observations, not financial advice.

SOL Confirms Bearish PatternSOL Confirms Bearish Pattern
On Friday, Solana confirmed a larger bearish pattern following Trump’s comments.
So far, the pattern remains valid, showing signs of a larger decline. Whether that happens remains to be seen in the coming days or weeks.
But given that BTC has started to correct further, it is possible that SOL could fall back to at least the 170 price zone, which was also tested on Friday.
The main targets I am considering if the price moves below this clear bearish pattern:
170
135
104
You may find more details in the chart!
Thank you and Good Luck!
❤️PS: Please support with a like or comment if you find this analysis useful for your trading day❤️

Sol trade idea
Solana is currently moving inside a bearish ascending channel.
I’m targeting a 50% retracement, which aligns with the Monday high and a fair value gap.
I’m waiting for confirmation, meaning I want price to break the channel, then retest from the MSS level.
If that retest shows weakness, I’ll look to enter the short setup.

#SOL/USDT Final Liquidity Zone Before Expansion?#SOL
The price is moving in a descending channel on the 1-hour timeframe. It has reached the lower boundary and is heading towards a breakout, with a retest of the upper boundary expected.
We are seeing a bearish bias in the Relative Strength Index (RSI), which has reached near the lower boundary, and an upward bounce is expected.
There is a key support zone in green at 130, and the price has bounced from this level several times. Another bounce is expected.
We are seeing a trend towards stabilizing above the 100-period moving average, which we are approaching, supporting the upward trend.
Entry Price: 132
First Target: 134
Second Target: 137
Third Target: 140
Remember a simple principle: Money Management.
Place your stop-loss order below the green support zone.
For any questions, please leave a comment.
Thank you.

SOL at a Major Turning Point — Big Move Ahead#SOL
SOL is sitting right on its major weekly support, a zone that has held the chart together multiple times. This area is still acting as the main foundation for the current structure 🧱
If SOL can bounce from here and push back into the resistance zone above, the chart opens the door for a larger continuation toward the upper distribution area 🚀
We can already see how clean the structure becomes once price reclaims that mid-zone.
But if this major support fails to hold, SOL could slide into the deeper accumulation zone — a long-term area where strong buyers usually step in 👀
Right now, SOL is at a critical point. How it reacts here will shape the next big weekly move. Stay patient and follow the reaction, not the prediction ⚡
#SOLUSDT

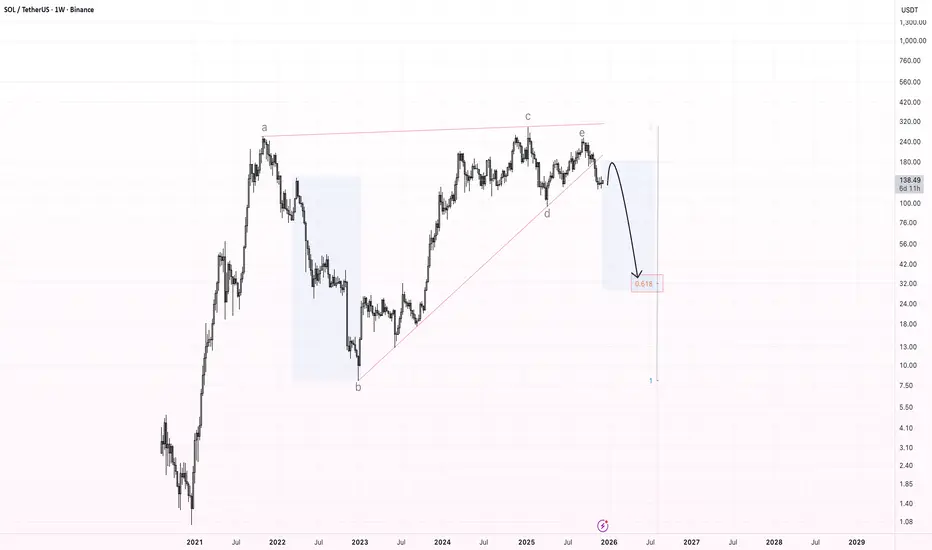
SOL – Bearish Rising Wedge Breakdown (Weekly Chart)The chart shows a large multi-year bearish rising wedge , which has now been broken to the downside. This wedge has been forming since the 2022 bottom and consists of clear wave structure (a–b–c–d–e), with the final wave e rejecting at the upper boundary and triggering the breakdown.
After this kind of pattern, the market often provides a relief bounce back into the broken support , which should now act as resistance . For SOL, the expected retest zone is located around $170–$190.
If price confirms resistance there, I expect the beginning of a larger downward wave , targeting the main Fibonacci zone near the 0.618 retracement, which aligns with a long-term target around $30–$40.
This zone marks the primary downside target for a full wedge breakdown.
Key Points:
Multi-year bearish rising wedge has broken.
Expected retest: $170–$190.
Major downside target: $30–$40 (0.618 zone).
Potential start of a macro corrective wave.
Big Money Is Pouring Into SOL – Is a Breakout Coming?When large capital starts flowing into Solana , SOLUSDT is no longer just another altcoin — it’s becoming a new safe haven for risk-on liquidity. Forward Industries recently announced that it now holds over 6.9 million SOL , making it one of the largest Solana treasuries in the world — a clear sign that institutional players are not just talking, but actually deploying capital.
On the technical side, the chart shows that SOL has broken away from its bottom structure and is now holding beautifully above the Ichimoku cloud. The area around 138 USDT has emerged as a new support zone: price has retested it multiple times without breaking, turning it into a solid base for accumulation. The current structure of higher lows confirms that buyers are still in control of the trend.
The most bullish scenario: SOLUSDT continues to consolidate above 138, compressing like a spring, before making a push toward the 153 USDT resistance area — exactly as projected on the chart. As long as price stays above 138 and the Ichimoku cloud remains below, the priority remains to buy dips, not to fight the trend.
In short, institutional inflows combined with a strong technical structure suggest that SOLUSDT is in a healthy, sustainable uptrend , and the current pullback looks more like an opportunity to enter, rather than a sign of weakness.

SOL for $79?Greetings to all 😊
Many people in their personal messages asked about the possible further movement of the SOL coin, after it reached the previously designated goals (see the last review)
💡 I can say one thing: while the asset is trading under the important level of $189.31 , it is not worth considering purchases for a long time, since the context is short
◾️ The global picture looks like this: we have a 12M chart that shows the reaction from the zone of interest and the price moving below the support level
◾️ I would like to note that we also have the min of last year, which has accumulated liquidity - 79$
⚡️ All timeframes are in a descending structure
▫️ If the price does not recover its values > 180$ this month, then I will expect a decrease to low (79$)
▫️ on the chart of the month , the price is trading sideways
▫️ We have removed the nearest liquidity on the weekly chart and are showing a corrective movement
▫️ On the daily timeframe, the price came to trend support and is trading sideways
Here we are interested in two zones between which the price is squeezed:
resistance of $ 145 - $ 151
and support of $133.74 - $ 137.76
📌 While the price is in uncertainty between sellers and buyers, it is better to wait for the manifestation of one side and then make a decision.
📍 And remember: not every deal is your deal.
Good luck to all ☘️

$SOL/USDT ANALYSISOn the **1-day chart**, BINANCE:SOLUSDT is currently rebounding strongly from a well-defined horizontal support zone around **$131–$137**, which has acted as a major demand area multiple times in the past. Buyers stepped in again from this zone with rising volume, showing accumulation interest after an extended downtrend. The price has now pushed back above the short-term daily lows and is testing the descending trendline drawn from the November swing highs, indicating that the market is trying to shift momentum.
The candlesticks are forming higher lows while rejecting deeper downside, suggesting short-term strength. However, the overall structure still remains under the broader bearish trendline and below the daily Ichimoku cloud, so this recovery phase will only confirm a reversal if SOL manages a **daily close above $150–$155**, which would break the trendline resistance and open room toward $170 and $190. If the price fails to close above the trendline and faces rejection near $145–$150, it may retest the $135–$131 support zone again.
In short, SOL is currently in a **corrective bullish bounce within a larger downtrend**, holding key support and attempting to break structure. A sustained breakout and close above $150 will mark a possible shift to medium-term bullish momentum, while failure to do so keeps it in a consolidating range between $131 and $150.

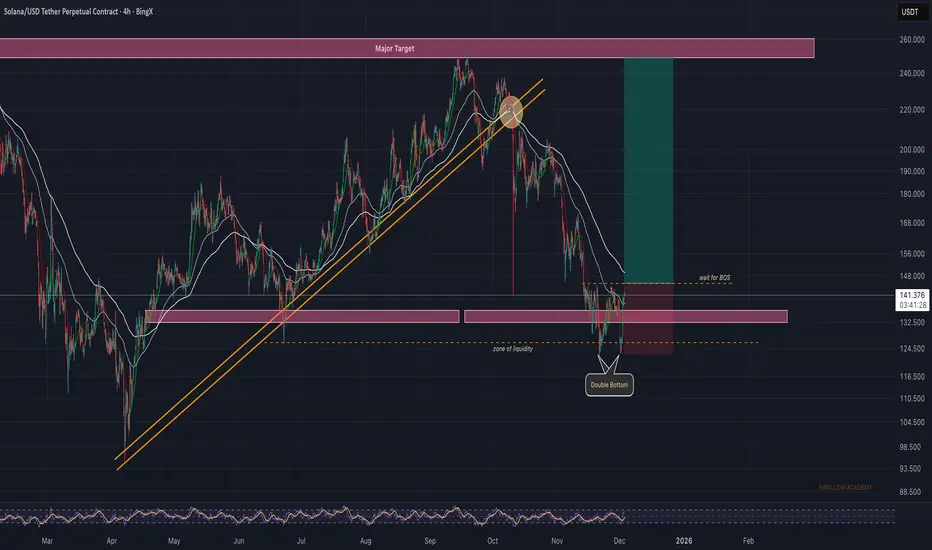
Solana (SOL): Expecting the Break of Structure Here | Bullish AFSOL printed a clean double bottom right inside the higher-timeframe support zone, which shows buyers are defending this area well. Now we need to see a proper BOS above the local structure to confirm that momentum is shifting back to buyers.
If that happens, the path toward the higher targets opens up, and this whole region becomes a solid long setup to work with.
Swallow Academy
SOL : LIVE TRADEHello friends
as you can see, after the resistance we set was broken, the price has grown well, and now with this red shadow, there is a sign of sellers entering, and there is a possibility of price correction, and the price can grow again from these areas and move to our targets, of course, if buyers support the support area again...
This analysis is purely from a technical perspective and is not a buy or sell recommendation, so please follow risk and capital management.
*Trade safely with us*

SOLCRYPTOCAP:SOL is back on major support and price continues to respect the level as it has historically. Each prior defense led to trend continuation. From this base, the projected upside toward target implies up to 250 percent potential if structure holds.
