spiral point turn 4/25 plus or minus .5 May 12th Major The chart posted is the SP 100 OEX we hit at the low near perfect math and now we are at 50 % of the drop Markets are at a crossroad best of trades WAVETIMER
OEX trade ideas

OEX MonthlyHigh lite the last recent notable monthly timeframe corrections range from 9 to 24 months.

I have now moved to an 80 % long PUTS in SPY and QQQ and SMHBased on the chart posted the OEX 100 is at a crossroad I can count this Two ways first the bullish count we are ending a wave 1 up of 5 of 5 in the blowoff wave and we would see an small abc decline toa .382 then I would cover Or if we break the .50 % pullback would would look for a sharp washout to the a minor new low .But if we break above 2951 then we are in the 5 wave up to two target 3045 alt 3147

WAVE 5 of 5 of 5 late stagesThe chart posted shows my top view of the wave structure I see today as ending wave 3 of 5 of 5 of 5 look for a minor pullback and then a final peak into monday or tuesday 5554/5631 So why am i just moving to 90% long puts because naaim snd PUT/CALL spirals are in the window as I said from 7/5 to 7/11 I will be fast Best of trades WAVETIMER

Thin AIR OEX I am now 33% long puts The sp 100 has reached into the fib relationship of a major top the sp 500 has Entered the min 5510 to 5531 RSI bearish setup I had hoped and the word is HOPED we print 5554 /5585 BUT cycles are running out and the Fang sector aka AAPL targets and msft in the lower end of super cycle targets .are being met . SOX has reach a perfect 1.618 and we saw the turn a second time . this shows the math is in control and that the fractals forming . Wavetimer I am now long march 485 qqq puts and spy 565 560 puts and RCL

SPIRAL FOCUS 3/23 THREE GOLDEN RATIO SPIRAL TURN 3/23 +OR- 1.5 As I had mentioned that a major turn is at hand we now have 3 spirals in place and the turns have begun see 2020 turns as well as the forecast aug 2022 3 spirals focused on aug 13 to the 20

S&P 100 Index - MACD Histogram Bullish FormationWith regard to the MACD Histogram, the Hawkeye Engine notes that the S&P 100 Index (OEX) has recorded 30 consecutive days above the 0 level. Historically, following the formation of this MACD pattern, OEX, displayed a positive expectancy over the next 20 trading days.
OEX - 20-day average absolute return 1.97%, standard deviation 2.79%, win rate 8 from 10, drift 0.41%.
Disclaimer: This data is not financial advice. Past performance is not a guide to future performance and may not be repeated. Past performance does not diminish the 'risk' expectancy of any strategy. By its very nature ‘risk’ means you could and most likely will experience losses. No representation or warranty is given as to the accuracy or completeness of any information provided. Data is for educational and informational purposes only.

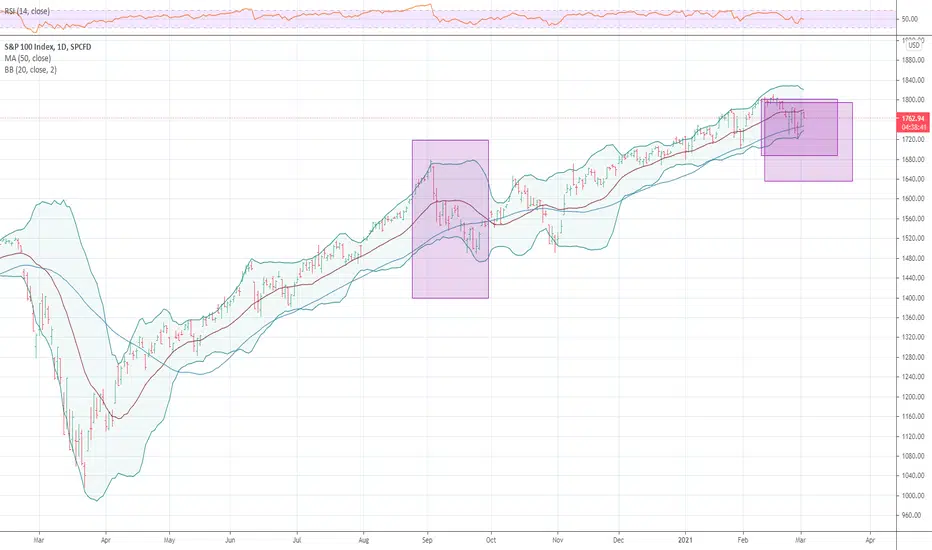
daily analysis of S&P 100indexHi friends
the daily chart of this market shows that it will experience with a high probability an uptrend in the next few days please subscribe to receive more analysis
thank you

S&P 100 INDEX WEEKLY ANALYSISHi friends
the weekly graph of this market shows that it will experience an upward trend in the coming weeks but at the same time the vigilance of the change in the opposite direction
please subscribe to receive new analyzes

S&P 100 versus all the rest S&P 500 and also Russell 2000 updateS&P 100 versus all the rest S&P 500 and also Russell 2000... Note that in the previous cycle 2003-2007 was a value cycle so the S&P 100 big cap names were underperform the broad market, growth cycles are mostly a concentrated big cap names phenomenon.

S&P 100 versus all the rest S&P 500 and also Russell 2000S&P 100 versus all the rest S&P 500 and also Russell 2000... Note that in the previous cycle 2003-2007 was a value cycle so the S&P 100 big cap names were underperform the broad market, growth cycles are mostly a concentrated big cap names phenomenon.


Smart Money has been exiting - true bottom yet to be found.Smart money is flowing out and has been for almost a week, was waiting for this dump. Most people think it's oversold so I expect a short comeup but a major comedown.
Crazy idea from a crazy TA :)
