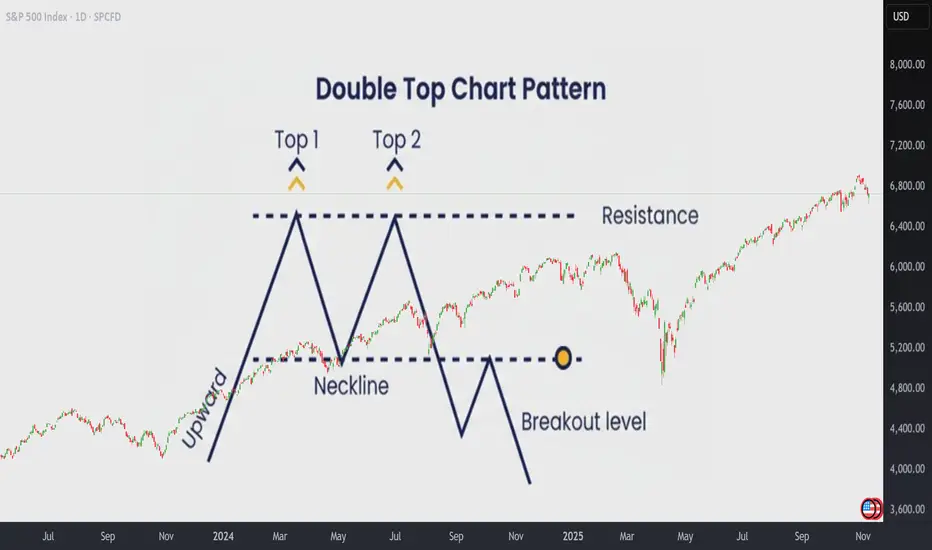
How to Trade the Double Top Pattern Like a ProHow to Trade the Double Top Pattern Like a Pro
The Double Top is one of the most reliable patterns in technical analysis. It often marks the beginning of a resistance zone and signals that bullish momentum is losing strength.
The first top is hard to anticipate, it’s usually just a continuati
SPX – Recovery Momentum Gradually ReturningThe U.S. stock market is regaining its upward rhythm after a period of correction, as investor sentiment improves notably on hopes that the U.S. government shutdown will soon end .
At the same time, the U.S. Dollar Index has stalled and bond yields have slightly declined , creating favorable condi

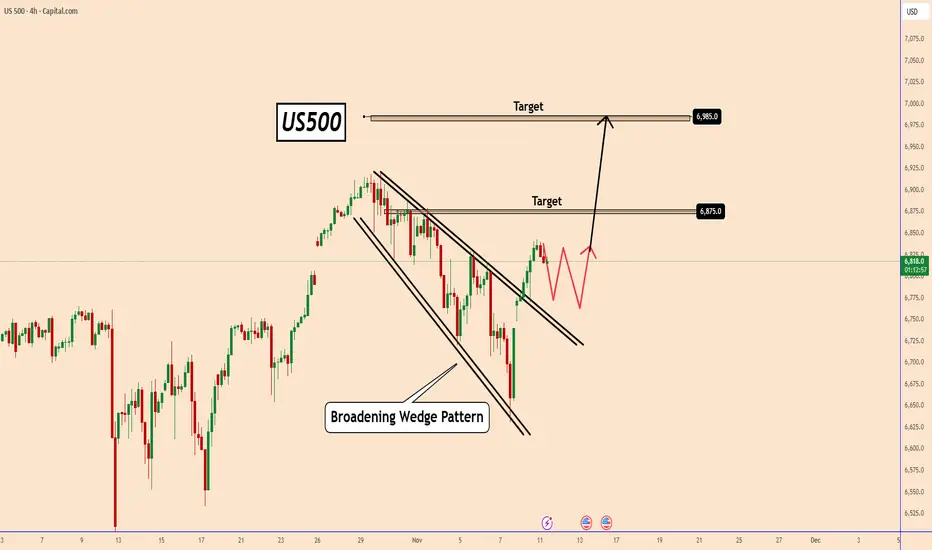
US500: Breaking Out of the Falling ChannelUS500: Breaking Out of the Falling Channel
The US500 index has finally broken out from its falling channel, signaling a potential continuation of the broader bullish trend.
After a strong recovery from recent lows, price action suggests a possible pullback to retest the breakout zone before targe
Hellena | SPX500 (4H): LONG to max of wave "3" area of 6929.4.Good afternoon colleagues, it looks like the correction is ending and soon I expect wave “5” in the upward movement. Perhaps wave “4” will update the low of 6637.8 before the upward movement.
I expect to reach the maximum of wave “3” at 6929.4. Further we will observe the price behavior in this are

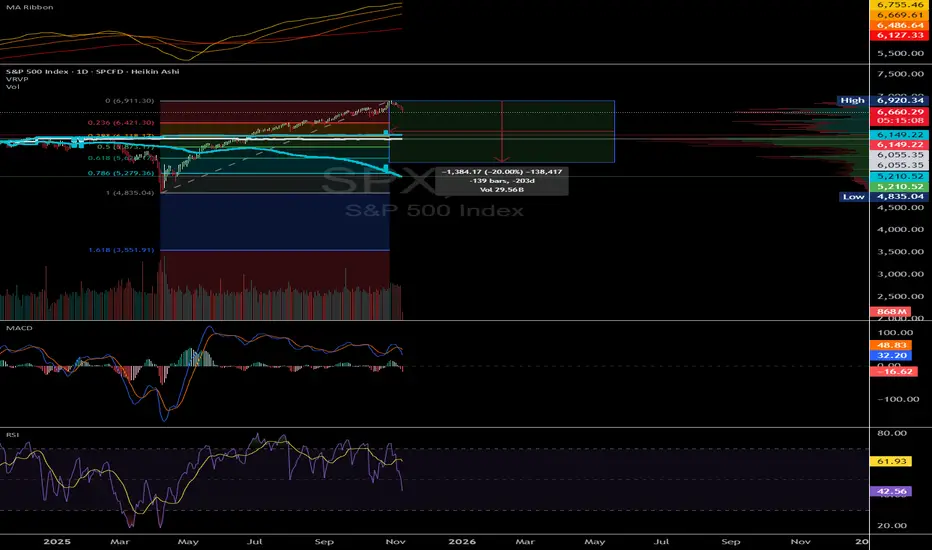
SPY/SPX Bear Market, liquidity speedbumps, and key levels SP:SPX AMEX:SPY
The current setup mirrors the prior rally from trough to peak, projecting a speculative 20% bear market range.
From here, I’m watching for a push into 6100–6200 that’s where strong resistance should form. If we reject that zone, it likely marks the start of a deeper unwind.
A
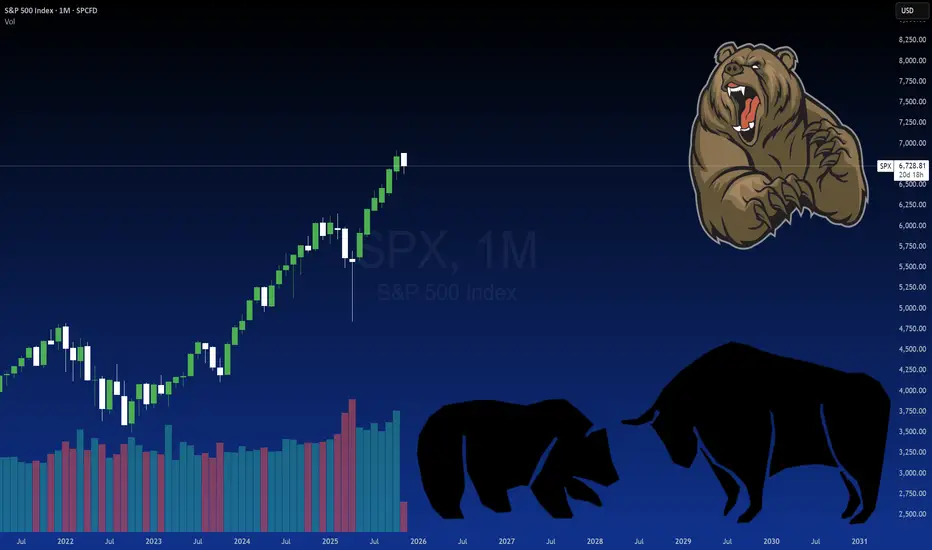
SPX: Bear Markets and Complacency Oh boy, we are here, about to have “the talk”. Didn’t think this would come up until 2026, but alas we are. It’s a loaded talk so get ready.
Bear markets, or less triggering, corrective markets. What about them, you may ask?
I am going to talk about the prospects of a bear market for the S&P sta
US 500 - Has All the Good News Been Priced?After a volatile and nervy 5 days for US stock indices the week ended on a slightly more stable and positive footing.
In relation to the US 500 index this volatility saw it open on Monday November 3rd around 6885, trade down to a low of 6633 early on Friday November 7th, before rallying by over

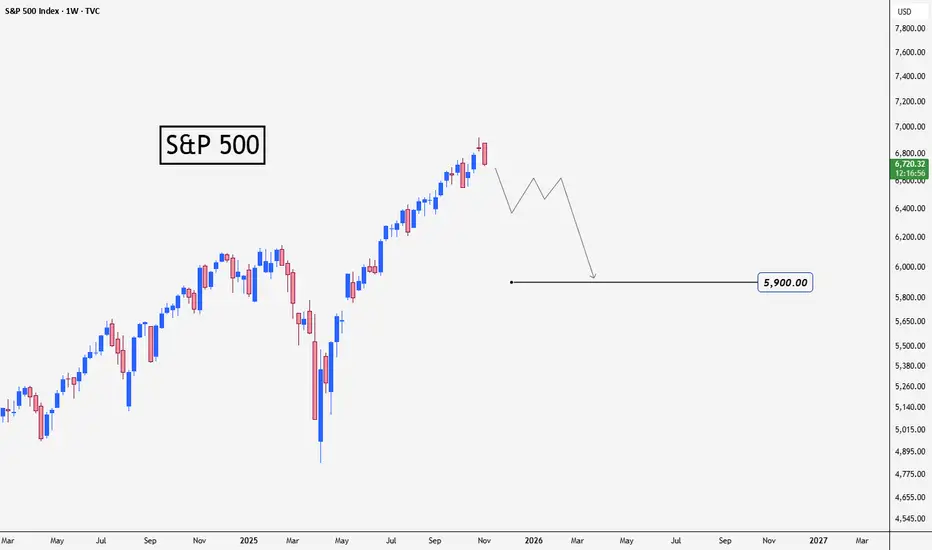
S&P 500 Predict the next waveHello everyone, I hope you are all well.
I wanted to share my prediction for the next wave of the S&P 500 index. It's as shown in the chart
The chart is on the weekly timeframe. I expect the decline to last for a period of time that could reach 6 months or more
This is not investment advice; plea
SPX Digests the Highs SPX spent the last week and a half digesting the new all-time high, pulling back deeper than I expected but holding the weekly trend. Price found support at 6,632 and closed back inside the yellow zone where we’ve seen noise before.
This week I’m watching for one of these scenarios: a sideways res

Important Breakout - US500Hello traders,
The US500 failed to create a new lower low, and the price broke the lower high — confirming a change of character (ChoCH)!
So, I expect a bullish move ahead 🚀
🎯 Target: 6890.0

See all ideas
Displays a symbol's price movements over previous years to identify recurring trends.
Frequently Asked Questions
S&P Index Cash CFD (USD) reached its highest quote on Oct 30, 2025 — 6,928.87 USD. See more data on the S&P Index Cash CFD (USD) chart.
The lowest ever quote of S&P Index Cash CFD (USD) is 2,177.62 USD. It was reached on Mar 23, 2020. See more data on the S&P Index Cash CFD (USD) chart.
S&P Index Cash CFD (USD) is just a number that lets you track performance of the instruments comprising the index, so you can't invest in it directly. But you can buy S&P Index Cash CFD (USD) futures or funds or invest in its components.