How to Trade the Double Top Pattern Like a ProHow to Trade the Double Top Pattern Like a Pro
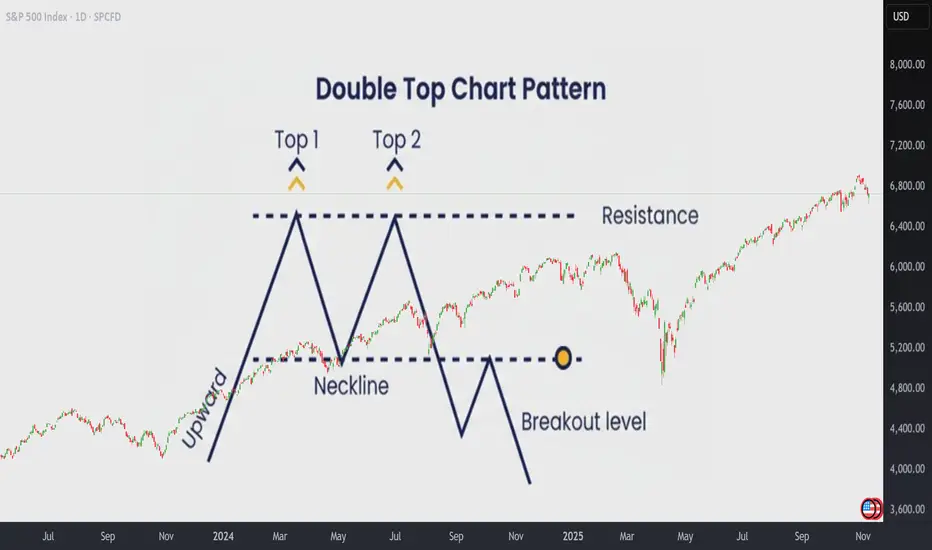
The Double Top is one of the most reliable patterns in technical analysis. It often marks the beginning of a resistance zone and signals that bullish momentum is losing strength.
The first top is hard to anticipate, it’s usually just a continuation of the existing rally. But when the second top fails to break above the previous high, that’s when things get interesting . This failure creates a resistance level, and it’s the first warning sign that buyers may be running out of steam.
🔵 Why Do Double Tops Form?
There are usually two main reasons why a Double Top appears:
Profit-taking after a strong rally.Bulls start to lock in profits, causing the momentum to fade.
Lack of new buyers . Demand weakens, and bears begin to take control gradually.
Learning to tell which case you’re facing can help you decide whether it’s a great buying opportunity during a healthy pullback, or a signal to take profits, or even go short .
🧭 Step 1: How to Identify a Real Double Top
Before trading it, make sure it’s a true Double Top:
- Both peaks must form after a strong upward move . If the market was falling before, it’s not a classic pattern.
- The two tops should be at almost the same price level (no more than a 0.5% difference).
- The most important part is the neckline , the lowest point between the two tops.
That neckline defines whether the move is just a healthy pullback or the beginning of a new downtrend.
If the neckline doesn’t break, there is no Double Top yet.
The pattern is only confirmed after the neckline breaks downward.
💥 Step 2: Trading the Pattern
There are three main scenarios to understand:
1️⃣ A Confirmed Double Top (Breaks Down)
When the neckline breaks, the market often drops about 61.8% of the pattern’s height, with a probability above 70%.
A small pullback to retest the neckline is possible, but usually, the price won’t return to the previous highs.
A Double Top is spotted:
The neckline is broken:
A decline happens sharply:
2️⃣ A Fake Double Top (Break Fails)
If the price fails to break the neckline and instead makes new highs, it’s not a real Double Top.
This typically means we’re in a profit-taking phase, not a trend reversal.
In these cases, it’s often best to stay out, as the market tends to move sideways or show mixed signals.
A spotted double Top:
Fails to break down, instead breaks up:
The rally unfolds:
3️⃣ A Double Top Trap in a Strong Bull Market
Sometimes, a small break below the neckline triggers stops before the price explodes higher again.
These are common during powerful bull runs.
A spotted double Top:
The neckline is broken:
Inmediately the price reverse and break upwards.
The price rallies:
💲 Real Double Tops:
Theory is simportant, but let's go real!
A Double Top is now unfolding in Microsoft , and as you can see the neckline is almost there! Is this a signal? Wil a fake breakout occur? Are we witnesing the end of AI rally?
And some previous Double Tops:
❗ A final recommendation
Tradingview offers a great indicato r to Spot Double Top patterns easily.
Once you are in a chart, click on indicators and search Double Top Chart Pattern indicator. It's only for paid users and works fine!
Take a look how it spots the Double Top pattern and also gives you and idea of the posible target price!
Or the current one in NASDAQ:MSFT
In short:
Double Tops work roughly 70% of the time , but context matters.
They perform best in sideways or slowing markets, and are less reliable in strong rallies , where false breaks can easily trap traders.
Always confirm the neckline break, watch for volume, and never forget:
A pattern is just a probability, not a guarantee.
Trade ideas
SPX – Recovery Momentum Gradually ReturningThe U.S. stock market is regaining its upward rhythm after a period of correction, as investor sentiment improves notably on hopes that the U.S. government shutdown will soon end .
At the same time, the U.S. Dollar Index has stalled and bond yields have slightly declined , creating favorable conditions for capital to return to large-cap equities.
On the 4H chart, SPX maintains a steady ascending channel structure , and the sharp rebound from the 6,800 zone signals that buyers are regaining control.
The current setup suggests the index could continue rising toward the 7,000 level, before a minor technical pullback — a healthy move to build momentum for the next leg higher toward the upper boundary of the channel.
With market sentiment turning increasingly positive , supported by bullish forecasts from major institutions like UBS (targeting S&P 500 at 7,500 by 2026), the short-term bullish bias for SPX remains intact.
As long as 6,800 holds firm, the uptrend structure stays valid, reflecting growing confidence that the U.S. market recovery cycle is far from over.

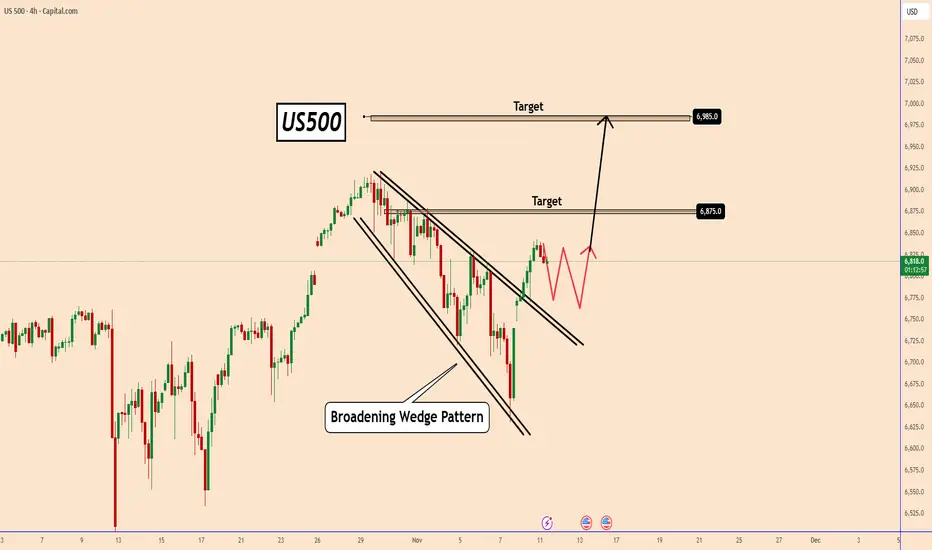
US500: Breaking Out of the Falling ChannelUS500: Breaking Out of the Falling Channel
The US500 index has finally broken out from its falling channel, signaling a potential continuation of the broader bullish trend.
After a strong recovery from recent lows, price action suggests a possible pullback to retest the breakout zone before targeting higher levels.
If momentum continues, we could see buyers pushing the index toward the 6,875 resistance zone first — and if that level gives way, the next target sits around 6,985.
Key levels to watch:
🎯Target 1: 6,875
🎯Target 2: 6,985
You may find more details in the chart!
Thank you and Good Luck!
❤️PS: Please support with a like or comment if you find this analysis useful for your trading day❤️
Hellena | SPX500 (4H): LONG to max of wave "3" area of 6929.4.Good afternoon colleagues, it looks like the correction is ending and soon I expect wave “5” in the upward movement. Perhaps wave “4” will update the low of 6637.8 before the upward movement.
I expect to reach the maximum of wave “3” at 6929.4. Further we will observe the price behavior in this area.
Fundamental Background
The US stock market remains positive: business activity data showed a steady expansion, which strengthens confidence in corporate earnings.
Manage your capital correctly and competently! Only enter trades based on reliable patterns!

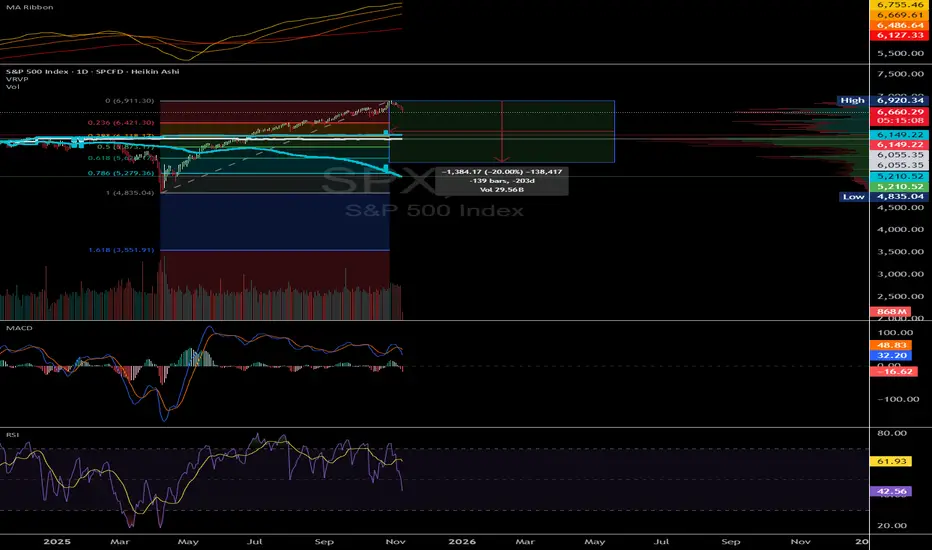
SPY/SPX Bear Market, liquidity speedbumps, and key levels SP:SPX AMEX:SPY
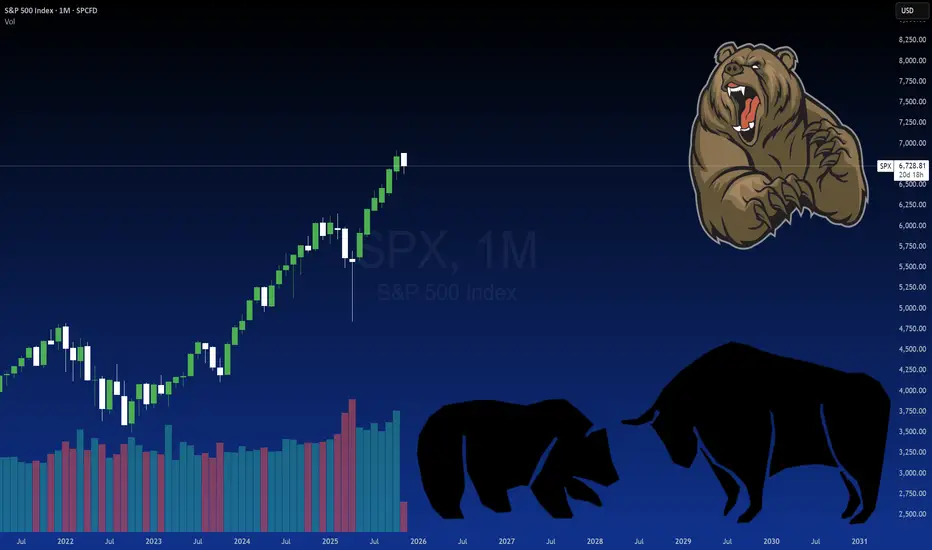
The current setup mirrors the prior rally from trough to peak, projecting a speculative 20% bear market range.
From here, I’m watching for a push into 6100–6200 that’s where strong resistance should form. If we reject that zone, it likely marks the start of a deeper unwind.
A quick overshoot toward 6000 wouldn’t surprise me and could trigger a dead cat bounce, but unless buyers regain control above 6200, the bounce should fade.
At 20% we'll be around $5550, where we’d likely find structural support. However a market shock around there could allow it to drop to $5200 if something happens while we're in that zone.
I don't think we'll go lower than $5000 moving forward
SPX: Bear Markets and Complacency Oh boy, we are here, about to have “the talk”. Didn’t think this would come up until 2026, but alas we are. It’s a loaded talk so get ready.
Bear markets, or less triggering, corrective markets. What about them, you may ask?
I am going to talk about the prospects of a bear market for the S&P starting right now. Like today. Like November of all times. I am also going to talk a bit about complacency in markets which snagged me bad this week. So get ready for some theory, analysis, application and market lessons/reflection, all in one post!
First off, bear markets. How do you identify them?
This is the million-dollar question! How do you identify bear markets? The truth is, they are mostly impossible to determine reliably, even with the most robust fundamental and technical analysis combined!
The approach I take to “preparing” for bear markets is usually on the fundamental side over everything else! It’s a bit of a hybrid, fundamental math, but traditionally what I use is simply the US money supply. It has served me well over the years and even prepared us for that correction we saw in early 2025, if you follow me and remember these posts:
Essentially by analyzing how far the value of the S&P is over the US Money supply, and creating a cointegrated relationship. Traditionally, I would use R to do this, but in my mission to bring more statistics to Pinescript, I no longer need to rely on R to provide the analysis, as the Econometrica indicator now exists ( available here ).
Using this indicator, we can take a look at SPY and SPX against the US money supply:
We can see that historically SPX has traditionally corrected over-extension through reverting back to the US Money Supply mean, or more technically the cointegrated relationship that exists of SPX value over US money supply value. However, currently, SPX is the farthest it has ever been above the US money supply.
Nuts!
If we look at SPY:
Nuts!
Additionally, we know that this is still relevant because despite SPY and SPX being so far above the US money supply, the Correlation and, more importantly, the R2 remains really high. Indicating that a substantial degree of variance of SPY can be explained by the US Money supply.
SPY and SPX can attempt to ignore it, but it will do so in vein because at the end of the day, the pair are two peas in a pod and inseparable. We know this from the strong correlation and R2 value of the cointegrated regression.
If you don’t believe it, simply watch and read my previous ideas that were posted about a month or two before we saw SPY and SPX tank >20% in the span of a month! It generally works, its just, timing is difficult.
Other, easier ways to identify bear markets:
There is no other way I have found with statistical rigour. Some of the worst performing ways are using EMAs. For example, the average distance from the daily EMA 200 SPY and SPX will travel before a bear market starts is 7 to 9%. However, of the 7 to 9% distance, only 6% of these are true lead ins to bear markets. That’s because, SPY and SPX spend a great degree of time between 7 to 9% away from the EMA 200.
Other ways like quantifying magnitude between bull and bear market cycles is more promising, though equally problematic. Studying magnitude between bear and bull markets (i.e. the percent gain from the bear market low to the bull market high prior to the next bear market) ranges from 4% to up to 100%, with the average being around 42%. Currently, SPY and SPX would be at 43.5% from its bear market/corrective cycle low:
And peaked at about 10% away from the EMA 200:
While these in silo are not helpful, seeing the confluence of signals does lend some potential rigour. In this case, we are incredibly over-extended from the US Money supply, we have surpassed the EMA threshold and we are >= the average bear – bull market cycle threshold. So there is that.
The last way is by creating a time series model that calculates the mean, and analyzing behaviour at various distances from this mean historically. I have had hit or miss success with this. This is not so predictive of actual bear market onsets, but it is 100% reliable for target prices (again, if you follow me, the calling of the 481 target price on SPY during the crash was thanks to this approach).
Lets talk about Bear markets in November
They’re rare. Very rare. They have been known to happen but in extremely rare circumstances. This is because November seasonality is incredibly strong. November is one of the best performing months for the S&P and many stocks as a whole!
If you ask some generic AI about bear markets starting in November, it will likely spit out 1980.
Ah yes, the 80s.
November 1980. While people were innocently doing aerobics while listening to Blondie, they never fathomed the -27% decline that awaited their markets, despite booming economies and AAPL coming to town (mind you, the big release was in 1984 when the market was healthy but apple still very much existed here).
But why am I talking about this so much? Who cares about 1980.
Well, yeah, that’s what I thought until I noticed something that peaked my interest. Let’s take a look at 1980:
Notice anything?
If not, don’t worry, here is it again with some reference:
And if we are still not really feeling it:
Interesting.
I was intrigued by the similarity, so I had to test it mathematically to ensure that it wasn’t just a coincidence. To do this, I pulled monthly data from SPX and isolated January 1980 to November 1980. I then ran a regression on this data against January 2025 to November 2025 (bearing in mind November just begun).
The results were:
Correlation: 0.918 (Strong positive relationship, meaning that the trend is identical between the periods).
R2: 0.843 (Meaning that 3/4s of the variance and movement of 2025 can be explained using 1980 monthly data).
Comparing it against a random year (in my testing case, January 1984 to November 1984), I got a correlation of 0.468 and an R2 of 0.219, indicating no strong link and no explanation of variance.
This verifies that this is not just some visual anomaly, there is actually some substance to this theory of the 80s. And why not? I mean, I see people rocking 80s hair cuts again on a daily basis, why not rock 80s markets while we are at it!
So then the question that arises from this is, okay, larger timeframe, sure, it explains the data a bit. But does it really align on the smaller timeframe (i.e. Daily timeframe)? Does it align well when we narrow the picture?
Well, for this, I tried it. And oh boy, buckle up.
Because we are comparing tit for tat, side by side, same days etc. without missing data (i.e. for the monthly, we ran the analysis with most of November data missing), we have the following results:
Correlation: 0.9444
R2: 0.8918
Its unreal. Had we known we could have predicted every single move SPX made this year! EVERY. SINGLE. MOVE. Hindsight is so annoying.
Now, because I am not a fundamental analyst, as I like to say, its time to cite some AI. Gemini is my preferred. So lets ask him/her what they think about the results:
“The strong correlation on the daily timeframe provides a high degree of confidence that the factors (macroeconomic, technical, or psychological) that drove the market trajectory in the first 214 trading days of 1980 are similar to those driving the 2025 market. This gives you a strong justification for using the remainder of the 1980 price data as a projection or probability model for the rest of 2025. ”
So now my logical question is “ Well, how do the fundamentals of 1980 compare to today ”? And this is what Gemini has to say about that:
The Central Theme: Inflation, Rates, and Recession Fear
The S&P 500's price action in 1980 was fundamentally shaped by the confluence of three major forces, all of which have strong parallels today:
1. High and Volatile Inflation
• 1980 Reality: This was the peak of the "Great Inflation" era. Inflation was incredibly high, peaking near 14% in the early part of the year, driven by oil price shocks following the 1979 energy crisis. This forced consumers and businesses to constantly adjust expectations.
• 2025 Parallel: While not at 14%, the post-pandemic inflation shock has been the worst in four decades. Prices have remained sticky, particularly in services, and have proven difficult to bring down to the Fed's target, leading to persistent uncertainty.
2. Aggressive Monetary Policy
• 1980 Reality: Paul Volcker, the Federal Reserve Chairman, was implementing radical, Volcker-shock policies to crush inflation. This involved driving interest rates to unprecedented levels (the Federal Funds Rate hit 20% in 1980). The market volatility reflected the uncertainty of whether the Fed would succeed and how much economic pain it would inflict.
• 2025 Parallel: The Federal Reserve has conducted the most aggressive rate-hiking cycle in four decades. The debate has continuously centered on whether the Fed is "done," whether they will "pivot," and whether the current high rates are sufficient to induce the necessary slowdown without causing a severe recession.
3. Economic and Geopolitical Uncertainty
• 1980 Reality: The economy was officially in a recession in the first half of 1980. Geopolitically, the Soviet invasion of Afghanistan and the Iranian hostage crisis created massive global instability, which directly impacted energy prices and market sentiment.
• 2025 Parallel: While the economy has been resilient, the persistent fear of an imminent recession remains a dominant theme. Geopolitically, ongoing conflicts in Ukraine and the Middle East continue to pose supply chain risks and put upward pressure on energy and commodity prices, mirroring the external shocks of the 1980s.
Oh man, where was AI many moons ago?
So, what happens next?
I want to assert something. I am not calling for a bear market here. I like to dabble in statistical analysis and I would be wrong to not have a discussion about this, in light of what I see and what is happening.
That said, there are still reasons to be bullish:
From a fundamental perspective, seasonality remains bullish and bear markets starting in November remain a rarity.
We also have, according to my projections, a high probability target up at 710 on SPY leading us into the end of December, with a historic hit rate of 87%.
We have, as well, the prospects of a Santa rally happening. If you recall my last idea on SPY, Santa rally’s happen on SPY around 75% of the time.
But what can we do with the information about 1980?
The simple answer, is we can observe and we can model. We can model an adjusted forecast based on the remainder of 1980 using current prices of SPX. And we can observe. We can observe the correlation and R square as time progresses to see if we are following the trajectory to the same degree and closeness as we are currently.
For the first one, the forecast, I am sure you are wanting this and wanting to observe it with your own eyes, so I went ahead and did the forecast in R. Here are the results:
As you can see, its mostly sideways. Though SPX made a new high after this point before coming down more. Timelines may be skewed however, which is why the R squared is 0.89 and not 1 (perfect).
So, sell it?
Maybe. I think, the key take away here, is exercise caution here.
A Note on Complacency
I want to give a quick note on the dangerous of complancency, even from the most experienced traders. I have been trading since 2018, and, for some reason, this year which has been incredibly bullish, I have just become complacent. Buying the dips and not thinking too much about it.
Traditionally, I would analyze all options, pay attention to all metrics and weigh forecasts and statistics equally. However, this year I have massively slipped into just mindless, buy buy buy trading.
This week was a wake up call for me, since it did not go as expected. It was also avoidable, since half of my stuff indicated the week was turning bearish. I chose to ignore in favour of being complacent and airing on the side of irrationality.
Trading can and is a grind. Its is a job if not worse than a job. Its not always enjoyable. But the one thing that is different about a job is when you cut corners trading, you will for sure pay the price. Whereas, with a job, you may get off the hook.
Be vigilant. Take breaks. And never corner cut! It’s a very important lesson for most! Don't be lazy, laziness breeds complacency.
That’s it.
This doesn’t count as my weekly post, so don’t worry because I didn’t share any analysis for next week haha.
Safe trades everyone and thanks for reading!
US 500 - Has All the Good News Been Priced?After a volatile and nervy 5 days for US stock indices the week ended on a slightly more stable and positive footing.
In relation to the US 500 index this volatility saw it open on Monday November 3rd around 6885, trade down to a low of 6633 early on Friday November 7th, before rallying by over 1% late in the session to close the week at 6742. The driver for the rally was news that Democrats and Republican lawmakers had restarted negotiations to try and resolve what has become the longest US government shutdown in history.
This shutdown has been reported by Bloomberg to be costing the US economy around $15 billion per week in lost productivity and has stopped the release of key US economic data readings, leaving Federal Reserve (Fed) policymakers in the dark regarding the health of the US labour market (Non-farm Payrolls) and the direction of inflation (CPI/PPI/PCE). Two areas which are crucial in helping them decide whether they have room, or the need to cut interest rates again at their next meeting in December.
Perhaps unsurprisingly, after a jittery week where the lofty valuations of AI firms were called into question and weighed on the price of the US 500 index, traders may now be looking at whether a resolution to the shutdown, which would restart the economic data flow again ahead of the Fed’s next rate decision on December 10th could be possible, bringing with it a potentially much needed boost to flagging sentiment.
On Sunday, traders received the news that the Senate had moved closer to an agreement, an update which has helped the US 500 to register an early gain of 0.5% (6790 at 0700 GMT) to start this new trading week. However, even if the agreed bill is eventually passed by the Senate, it must be approved by the House of Representatives and signed by President Trump (Reuters), meaning there could be more volatility ahead for the US 500.
Technical Update: Conflicting Signals Within Weekly & Daily Perspectives
Since the October 30th all-time high at 6925, the US 500 index has slipped just over 4.2%, reflecting an unwind of potentially over-extended upside conditions.
Looking at the charts there appears to be conflicting technical signals between the weekly and daily perspectives at present, leaving the directional bias uncertain heading into the new week.
Upcoming sessions could offer clarity on whether the constructive themes emerging on the daily chart or the possibly negative developments evident in the weekly view may take control.
Weekly Chart – Potential Negative Outlook?:
Over the past three weeks, a possible Evening Star pattern has emerged on the weekly chart, a potentially negative development. Last week’s price weakness may have completed a sentiment shift, and if downside momentum builds, it could lead to further declines in the sessions ahead.
It remains to be seen whether this leads to further price weakness, but downside pressure may now build. If developed further, breaks below support at 6503, the October 2025 low could materialise, opening the door to a deeper phase of weakness toward 6214, a level equal to the August 2025 low, potentially even 6105, the 38.2% Fibonacci retracement of the April to October 2025 rally.
Daily Chart – Potential Positive Sentiment Shift?:
Following the recent sharp price decline, the daily chart presents a dilemma for traders, especially against the backdrop of a potentially negative weekly setup. Friday’s session initially extended recent downside moves but found support at 6647, the 38.2% Fibonacci retracement of the April to October rally. From there, fresh strength emerged, and the session closed near its opening level at the upper end of the day’s range.
Candlestick analysis suggests a potentially positive Dragonfly Doji has formed, hinting at an attempt to resume price strength. Confirmation is key, a positive candle on Monday, seen with a close above todays 6769 opening level, would offer weight to this pattern.
While not a guarantee of further upside, such activity might also see a close above resistance at 6779 (half the latest decline) a level at present being tested (0700 GMT), to potentially suggest a retest of 6925, the October 30th high.
Initially it is unclear whether the weekly or daily outlook will gain the upper hand in the US 500 index, but next week’s price action, especially the moves on Monday, could be important.
With the weekly chart hinting at a negative reversal risk and the daily chart showing signs of potential stabilisation, even possible positive risks, Monday’s candle direction may offer clues, and traders may be watching closely for evidence of the next directional themes.
The material provided here has not been prepared accordance with legal requirements designed to promote the independence of investment research and as such is considered to be a marketing communication. Whilst it is not subject to any prohibition on dealing ahead of the dissemination of investment research, we will not seek to take any advantage before providing it to our clients.
Pepperstone doesn’t represent that the material provided here is accurate, current or complete, and therefore shouldn’t be relied upon as such. The information, whether from a third party or not, isn’t to be considered as a recommendation; or an offer to buy or sell; or the solicitation of an offer to buy or sell any security, financial product or instrument; or to participate in any particular trading strategy. It does not take into account readers’ financial situation or investment objectives. We advise any readers of this content to seek their own advice. Without the approval of Pepperstone, reproduction or redistribution of this information isn’t permitted.

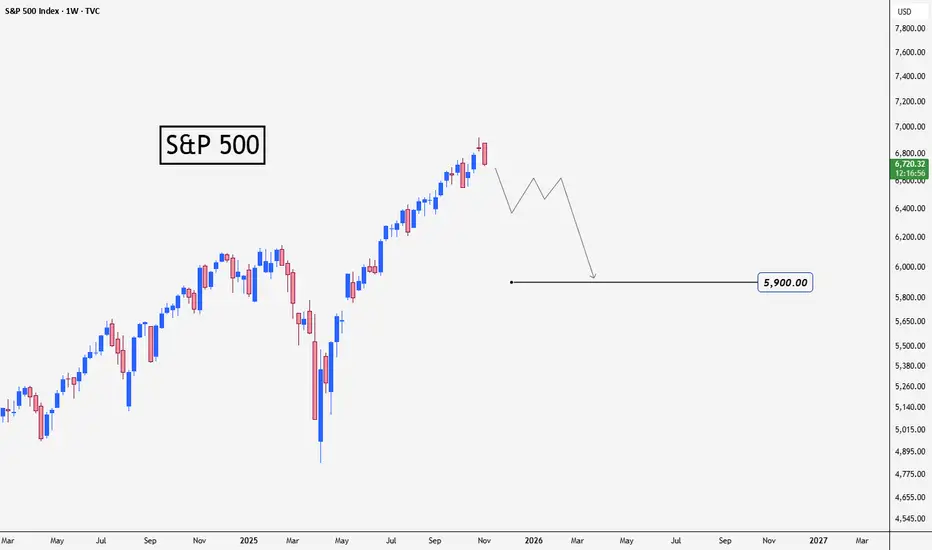
S&P 500 Predict the next waveHello everyone, I hope you are all well.
I wanted to share my prediction for the next wave of the S&P 500 index. It's as shown in the chart
The chart is on the weekly timeframe. I expect the decline to last for a period of time that could reach 6 months or more
This is not investment advice; please take full responsibility for your buying and selling decisions.
Warning: Be careful not to use this idea with leverage, as you could lose all your money
SPX Digests the Highs SPX spent the last week and a half digesting the new all-time high, pulling back deeper than I expected but holding the weekly trend. Price found support at 6,632 and closed back inside the yellow zone where we’ve seen noise before.
This week I’m watching for one of these scenarios: a sideways reset that drifts higher, a cleaner rebound through the moving averages, or a retest of support with a possible shakeout toward 6,555 (weekly chart shows support for this so it could also be a positive week followed by a decline).
The broader uptrend structure is still intact, and I still have a bullish bias, but I will be more attentive of a retest and roll over. We declined about 4% from the ATH but have easily declined around 8% -10% on earlier digestions this year.

Important Breakout - US500Hello traders,
The US500 failed to create a new lower low, and the price broke the lower high — confirming a change of character (ChoCH)!
So, I expect a bullish move ahead 🚀
🎯 Target: 6890.0

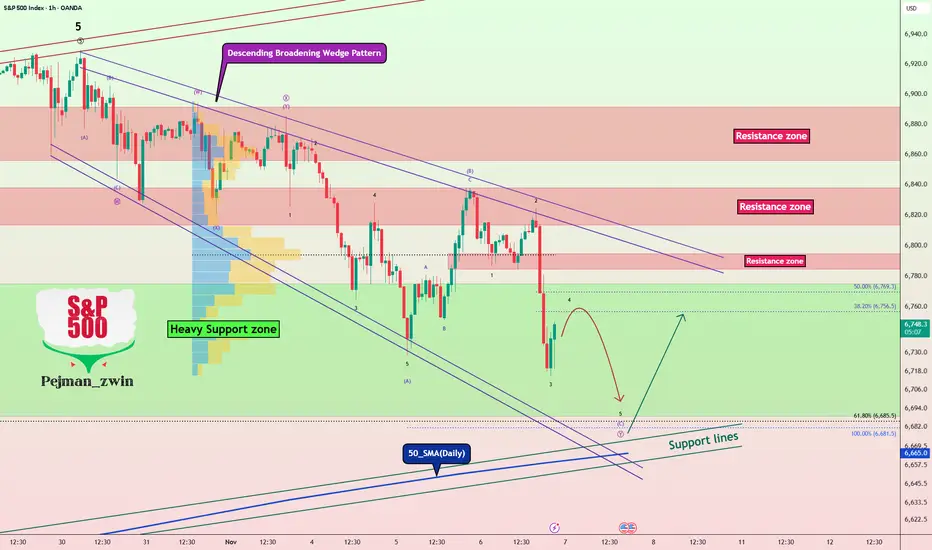
S&P 500 at Make-or-Break Level – Bulls’ Last Chance!As I expected in the previous idea , the S&P 500 index ( SP:SPX ) has reached its target.
Given that the S&P 500 index has a strong correlation with other financial markets, especially Bitcoin ( BINANCE:BTCUSDT )—sometimes even tracking them candle-by-candle—it's a good idea to pay extra attention to the S&P 500 index these days.
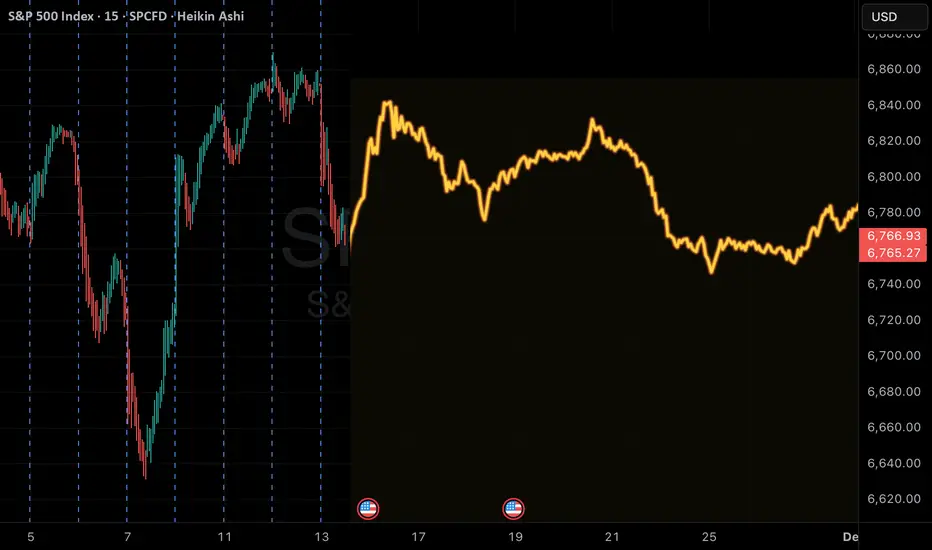
Currently, the S&P 500 index is moving in a Heavy Support zone($6,775_$6,689) , although it entered this zone with a lot of downside momentum.
From a classic technical analysis perspective, there's still a chance that the descending broadening wedge pattern will hold. As long as this pattern isn't invalidated, we can still hope for at least a short-term bullish move.
From an Elliott Wave perspective , it seems like the S&P 500 index is completing the microwave 4 of the microwave C of the main wave Y within the descending broadening wedge.
I expect that after the next small dip, the S&P 500 index will start rising again from near the lower boundary of the wedge, the 50_SMA(Daily) , and Support lines .
Note: If the S&P 500 index falls below about $6,650, we should expect further downside. So let's keep an eye on that level.
Please respect each other's ideas and express them politely if you agree or disagree.
S&P 500 Index Analyze (SPX500USD), 1-hour time frame.
Be sure to follow the updated ideas.
Do not forget to put a Stop loss for your positions (For every position you want to open).
Please follow your strategy and updates; this is just my Idea, and I will gladly see your ideas in this post.
Please do not forget the ✅' like '✅ button 🙏😊 & Share it with your friends; thanks, and Trade safe.
S&P 500 – Topping Signs Emerging Amid Momentum DivergenceThe S&P 500 appears to have formed a potential top, with initial downside targets near 5,700. In a more pronounced bearish scenario, price could extend toward 4,900—representing roughly a 27% correction from the highs. The index has rejected from the upper boundary of its ascending channel, while both RSI and Stochastics show clear bearish divergences. These technical signals suggest that upside momentum is fading, and a medium-term corrective phase may be developing.

SPX about to come crashing down hard. Buckle up.The parabolic growth curve that started almost 30 years ago in the US stock market is about to come to a dramatic conclusion.
We saw a test example of what happened in April when the market for the first time in 27 years broke through the parabolic growth curve, how quickly things just fell apart. Falling more than 10% in just a few days and then sharply rebounding to reclaim the parabolic growth curve.
Well, get prepared for an even more disorderly crash about to hit the market. We are for the second time in a year, right now losing the parabolic ascent.
No one actually believes the US economy is growing parabolically right? Even viruses don't achieve this level of "growth".
It's all built on a phony baloney house of cards called the US Dollar backed by nothing but the "full faith and credit" of the US. Well guess what? The credit of the US is constantly being downgraded by bond rating agencies. And we elected a leader who destroyed every other countries' faith in us. Consider poor Canada and the faith they have in us now. You might laugh and think these kinds of things are silly, but I promise you it's deadly serious. We have NOTHING but hot air backing the US dollar now because we have no faith and our credit is in the dumpster.
Also for comparison sake, I included the angle of growth (copy and pasted the small yellow line) that we had in the "raging" 1990s bull market. If you were alive during that time, the market was truly considered raging. But compare the angle of ascent to the last 6 months since Taco trump announced his worldwide agenda to destroy the US. The angle of ascent is almost pornographic compared to the 90s rager.
Parabolas don't unwind. They crash.
What other confluence do we have in the indicators to prior year crashes?
1) VIX 8day RSI achieved its lowest ever stochastic %D this summer, numbers 2 and 3 were 2007 and 2000.
2) P/E ratios are the highest they have ever been at 40+, only exceeded by one other time +44, just before the dot com crash.
3) 2y 10 y bond yield differential maintaining above .42% like every prior recessionary crash.

S&P 500 Technical & Fundamental Outlook — Week of Nov 10–14 2025Price is pushing back into a key trendline / resistance zone after bouncing off 6,550–6,600 last week. This area between 6,780–6,830 is the decision point. We either break through and resume the trend higher, or this bounce gets sold into and we rotate back lower.
Key Levels
6,780–6,830: Main resistance. Trendline + prior structure. This is where direction gets decided.
6,922–6,940: If we break above the zone above, that’s the next upside target and potential trend continuation.
6,659: First downside support if price rejects this trendline.
6,550: Major support. If this goes, momentum shifts bearish.
Trend Context:
Bigger trend still leans bullish overall, but in the short-term price is still correcting until we reclaim and hold above the resistance zone.
Trade Path Scenarios
Upside:
A break and hold above 6,830 opens the move back toward 6,922 → 7,009. Best setup is buying the retest, not the breakout spike.
Downside:
If price rejects the 6,780–6,830 zone, look for a pullback toward 6,659.
Break 6,659 → continuation lower to 6,550.
Break 6,550 → bigger shift in structure and sentiment.
Macro This Week (U.S. Focus)
This is inflation week, meaning the market will likely be quieter early and then expand in volatility Thursday–Friday.
Day Focus
Wed FOMC Waller speaks — tone will matter
Thu CPI (core + headline) + Jobless Claims → Main market mover this week
Fri PPI + Retail Sales confirm or reject the CPI move
Key point:
Market direction this week will follow CPI first, then PPI / Retail for confirmation.
Current Market Tone
Market is still split: AI / tech strength vs weakness in broader sectors.
Last week’s pullback came from valuation pressure and softer labor tone.
Traders are waiting for confirmation on whether inflation is still cooling.
Breadth remains weak, meaning moves can be sharp once the trendline resolves.
Plan Going Into the Week
Wait for price to show its hand at 6,780–6,830.
Reaction Trade Bias
Hold above 6,830 Long toward 6,922 → 7,009
Reject at the zone Short back to 6,659
Break 6,659 Short continuation to 6,550
Break 6,550 Trend turns heavier to the downside supported by bearish news on growth

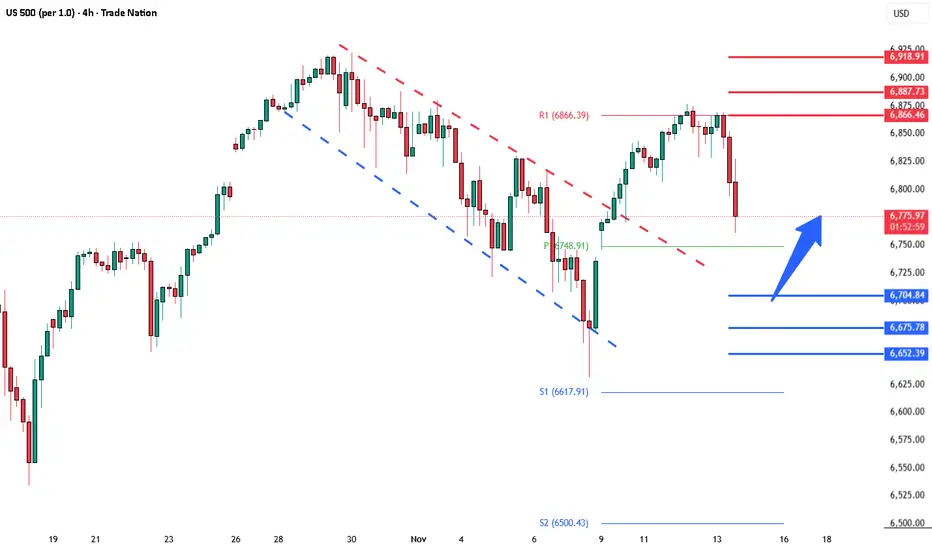
S&P Key Trading LevelsKey Support and Resistance Levels
Resistance Level 1: 6866
Resistance Level 2: 6890
Resistance Level 3: 6920
Support Level 1: 6704
Support Level 2: 6675
Support Level 3: 6650
This communication is for informational purposes only and should not be viewed as any form of recommendation as to a particular course of action or as investment advice. It is not intended as an offer or solicitation for the purchase or sale of any financial instrument or as an official confirmation of any transaction. Opinions, estimates and assumptions expressed herein are made as of the date of this communication and are subject to change without notice. This communication has been prepared based upon information, including market prices, data and other information, believed to be reliable; however, Trade Nation does not warrant its completeness or accuracy. All market prices and market data contained in or attached to this communication are indicative and subject to change without notice.
sp500 4h🔹 Overall Outlook and Potential Price Movements
In the charts above, we have outlined the overall outlook and possible price movement paths.
As shown, each analysis highlights a key support or resistance zone near the current market price. The market’s reaction to these zones — whether a breakout or rejection — will likely determine the next direction of the price toward the specified levels.
⚠️ Important Note:
The purpose of these trading perspectives is to identify key upcoming price levels and assess potential market reactions. The provided analyses are not trading signals in any way.
✅ Recommendation for Use:
To make effective use of these analyses, it is advised to manually draw the marked zones on your chart. Then, on the 15-minute time frame, monitor the candlestick behavior and look for valid entry triggers before making any trading decisions.

Nov 7th bull trap to 18ma is possibleI think another ABC is going to appen with the C starting after open. A rally for most of the day is what I'm thinking. if it just falls, I'm obviously wrong. A test of the 18ma would be the goal, but at that point I think it would be a short entry. Gold still bear flagging. Oil, back above the 18ma again - looks like accumulation. BTC perhaps lower, but it should also rally with the SPX if I'm correct.

S&P500 New Bullish Leg confirmed targeting 7150.The S&P500 index (SPX) offered us, as we mentioned on our last analysis, an excellent buy opportunity last Friday as it hit its 1D MA50 (blue trend-line) and bounced.
Having broken and closed yesterday above its 4H MA50 (red trend-line), it has technically confirmed the new Bullish Leg of the 6-month Channel Up. Based on all previous ones, it should target the 2.5 Fibonacci extension at 7150, which remains our long-term Target for the end of the year.
Notice also how similar the 1D RSI patterns are of October and August. Steady rise is expected for November getting into December.
---
** Please LIKE 👍, FOLLOW ✅, SHARE 🙌 and COMMENT ✍ if you enjoy this idea! Also share your ideas and charts in the comments section below! This is best way to keep it relevant, support us, keep the content here free and allow the idea to reach as many people as possible. **
---
💸💸💸💸💸💸
👇 👇 👇 👇 👇 👇

Backtesting 101: How to Turn an Idea Into a Tested StrategyEvery trader has thought it:
“If I’d just followed that setup every time, I’d be up big.”
That’s where backtesting steps in, it separates luck from logic.
It’s how you find out whether your strategy has a real edge, or just worked in hindsight.
Most traders skip it, not because it’s useless, but because it forces them to face the truth.
But if you can handle that truth, backtesting will make you a far more confident trader.
What Backtesting Really Is
Backtesting means applying your trading rules to historical data to see how your system would have performed.
It’s not about predicting the future, it’s about proving whether your idea works in different market conditions.
When done properly, it gives you three key insights:
Profitability: does your edge actually exist?
Risk: how deep are the drawdowns, and can you handle them?
Consistency: does it work across bull, bear, and sideways markets?
A solid backtest gives you confidence, not because it guarantees profit, but because it exposes weakness before the market does.
The Most Common Mistakes
Curve-fitting: tweaking rules until the past looks perfect.
Ignoring fees and slippage: small costs that quietly erase profits.
Testing too little data: short periods create false confidence.
Focusing on one market: edges must survive different conditions.
If your backtest looks too clean, it’s probably lying to you.
Why It Matters
Backtesting builds trust in your system and discipline in yourself.
When you know your data, you stop second-guessing every trade.
Losing trades stop feeling like failure, because you understand they’re part of a proven edge.
Even bots rely on backtesting. Without it, automation is just random execution.
With it, every trade follows structure, not emotion.
All of these points make a difference between a winning or losing strategy.
From Idea to System
Every strategy starts as a hypothesis.
Backtesting turns that hypothesis into data.
Data turns into structure.
Structure turns into consistency.
That’s the real path to professional trading - logic first, emotion second.

Change in the analysisWith no bounce to speak of and now the vix comfortably over 20, the chances are good we are in the middle of a C wave to 6500 and possibly lower.

S&P500 (US500): Important Breakout & Bullish Continuation
US500 likely completely a correctional movement,
breaking a resistance line of a bullish flag pattern on a 4H time frame.
I think that a bullish wave is going to start soon
and the market will reach at least to 6917 level.
❤️Please, support my work with like, thank you!❤️
I am part of Trade Nation's Influencer program and receive a monthly fee for using their TradingView charts in my analysis.

Peak Tech Earnings Wrapped Up: Here Are the Winners and LosersWe're past that time when we all get glued to the dual-monitor setup and watch the titans of tech parade their financials.
Last week was the Super Bowl of earnings season, with Meta NASDAQ:META , Microsoft NASDAQ:MSFT , Alphabet NASDAQ:GOOGL , Apple NASDAQ:AAPL , and Amazon NASDAQ:AMZN all reporting in the span of just a couple of days.
The result? A mixed bag of profits, promises, and expenses, all revolving around the familiar AI growth story. Some soared. Others sank. And everyone was reminded that in Big Tech , growth costs money — a lot of it.
Let’s unwrap what happened in the most influential week of the earnings calendar .
🥴 Meta: The Spending Spree Continues
Meta NASDAQ:META suffered the most bruising showing. On paper, revenue looked great — $51.2 billion, up 26% year over year and above estimates. But earnings per share? A brutal $1.05, far below the expected $6.72, after a nearly $16 billion one-time charge tied to President Trump’s “Big Beautiful Bill.”
Without that charge, net income would’ve jumped to $18.6 billion. Instead, the headline number showed $2.7 billion — not exactly inspiring. But the real story wasn’t the miss. It was the spending.
Meta now plans to splurge $71 billion this year, up from $69 billion, mainly on AI data centers and a hiring binge in its research division. The stock dropped 11% on Thursday.
🧠 Alphabet: Ads Strong, Cloud on Fire
If Meta NASDAQ:META stumbled, Alphabet NASDAQ:GOOGL strutted. The Google parent beat on everything : earnings per share at $2.87 vs. $2.26 expected and revenue hitting a record $102.3 billion, up 16% year on year.
The company took a $3.5 billion fine from the European Commission — but even with that, margins looked healthy. Excluding the fine, the operating margin would’ve hit 33.9%. Not bad for a firm still making 85% of its money from ads.
The real fireworks were in Google Cloud, where sales rose 34% and profit margins improved to 24% from 17% last year. Alphabet stock jumped 2.5% Thursday.
🧩 Microsoft: Cloudy with a Chance of Heavy Capex
Microsoft NASDAQ:MSFT delivered classic consistency — and then some. The company reported earnings per share of $4.13, beating estimates, on $77.7 billion in revenue. Azure, the star of the show, grew 40%, topping expectations.
Yet shares dipped 3% the day after as investors fixated on capital spending. Microsoft shelled out $34.9 billion last quarter and warned that capex growth in 2026 will exceed 2025.
🍏 Apple: New Phone Who Dis?
Apple NASDAQ:AAPL is back, everyone. The company posted record revenue of $102.5 billion , slightly above expectations, and hinted that the holiday quarter will be even juicier.
CFO Kevan Parekh said sales could rise 10–12%, led by a “double-digit” surge in iPhone 17 upgrades. After years of lukewarm demand, Apple’s upgrade cycle looks hot again.
One blemish: China sales dipped, underscoring the company’s ongoing battle in its second-largest market. But services revenue — now over $100 billion annually — continues to shine as Apple quietly transforms into a subscription empire disguised as a hardware company.
The stock erased a 3% Friday gain to dip into the red.
🚀 Amazon: AI, Efficiency, and a Holiday Boom
Then there was Amazon NASDAQ:AMZN , the comeback kid of this earnings season. The e-commerce giant’s revenue soared 13% to $180 billion , and profit surged 39% to $21.2 billion. Solid.
Amazon Web Services grew 20%, its fastest clip since 2022, as AI demand turned into real money. CEO Andy Jassy said data center expansion will remain a top priority heading into 2025.
The company managed to sprinkle in some “efficiency” — laying off 14,000 employees, a move expected to cost $1.8 billion now but save plenty later.
Amazon’s stock shot up 10% in pre-market Friday, and held on to the increase, proving that just a select few companies can pivot from layoffs to record profits with such finesse.
🧾 The Takeaway
So, what did we learn from Peak Tech Week?
America’s highflyers are spending big to secure their AI future. The underlying theme is that AI costs a fortune, but not investing in it could cost even more.
In short — the future is bright, the bills are bigger, and the market’s message is clear: keep growing, but try not to spook traders while you do it. The earnings show continues with AMD NASDAQ:AMD and Palantir NASDAQ:PLTD reporting this week.
Off to you : Are you looking to scoop up some NASDAQ:META or sell some NASDAQ:AMZN ? Share your thoughts in the comments!

SPX QuantSignals V3 0DTE – High-Conviction PUT Alert SPX 0DTE Signal | 2025-11-13
Market Context:
SPX faces heavy selling pressure after a -1.22% intraday drop, with RSI at an extreme 8.1 (oversold zone). Despite Katy AI’s neutral 50% confidence, momentum and sentiment indicate short-term downside continuation.
AI Insight (QuantSignals V3):
Confidence: 72% (Medium)
Predicted Range: $6769 → $6667 (-1.5%)
Gamma Risk: Low
Flow Intel: Neutral
Signal Type: 0DTE PUT
Trade Setup:
🎯 Strike: 6770 PUT (Exp. 2025-11-13)
💵 Entry: $15.30
🎯 Target 1: $22.80 (+50%)
🎯 Target 2: $30.60 (+100%)
🛑 Stop Loss: $10.70 (-30%)
📏 Position Size: 2% (Low-Moderate Risk)
🕒 Exit By: 2:00 PM ET (Time Decay Risk)
Technical Summary:
EMA alignment: Bearish
RSI: 8.1 (Extreme Oversold)
MACD: -6.23 (Bearish)
Support: $6667.58 (Katy stop)
Resistance: $6869.91 (session high)
Key Notes:
⚠️ Katy’s model predicts upside, but real-time technicals override AI summary.
⚡ Momentum + sentiment confirm short-term PUT bias.
📉 Use tight stop & scale profits fast — 0DTE = fast decay.