S&P 500 ROAD TO 7000 $SPX1. Executive Summary:
Following a significant correction from the 5000 level, the S&P 500 showed initial signs of stabilization on April 7th, 2025. The index had previously been rejected from a major resistance zone near the psychologically significant 7000 mark, having peaked around 6900. The current technical structure suggests a period of consolidation or pullback is underway. Critical support is identified in a layered zone between 6600 and 6200. A key finding from Fibonacci retracement analysis indicates that a hold above the 0.236 level (6428.21) could provide the necessary momentum for a renewed bullish assault, with the ultimate objective of retesting and breaking the 7000 level.
2. Recent Price Action & Market Structure:
Bullish Regeneration (7th April): The price action on this date is technically significant as it represents the first meaningful attempt to "regain" footing after a sustained drop. This could indicate that the initial wave of selling has exhausted itself, allowing buyers to step in.
Key Resistance & Rejection: The prior rejection from the ~6900 zone is a pivotal event. The failure to break through 7000 created a clear ceiling, establishing this area as a major resistance level that the market must now overcome to resume a long-term bullish trend.
3. Support Zone & Fibonacci Analysis:
The market has defined a clear hierarchy of potential support levels that will be critical in determining the next major directional move.
Layered Support Levels:
Immediate Support (6600): This is the first line of defence for the bulls. A bounce from here would indicate underlying strength and suggest the pullback is shallow.
Primary Support (6400): This level converges closely with the key Fibonacci level and is therefore a high-priority zone for buyers.
Significant Support (6200): A breach below 6400 would make this the next critical floor. A hold here is essential to prevent a deeper correction.
Fibonacci Retracement Context:
The Fibonacci tool has been applied to the most relevant upward move (likely from the 5000 low to the 6900 high).
0.236 Fibonacci Level (6428.21): This level is critically important. It represents a shallow retracement of the prior uptrend. The fact that it aligns with the identified 6400 support zone adds significant technical confluence.
Bullish Implication: A successful "bounce" from this ~6400/6428 confluence zone would be a strongly bullish signal. It would indicate that the broader uptrend remains intact and that the drop from 6900 is merely a healthy correction within a larger bull market. This would be the confirmation needed to project a move back towards the 7000 resistance.
Deeper Retracement Scenario (0.382 at 6123.76): Should the 0.236 level fail, the next major support resides at the 0.382 Fib level (6123.76), which aligns with the 6200 support. A bounce from this deeper level would still be constructive but would indicate a longer and more significant period of consolidation before a new high can be attempted.
4. Synthesis and Forward Projection:
The technical picture presents two primary scenarios:
Bullish Scenario (High Probability if 6400 Holds): The index finds strong support at the 6400/6428 confluence zone. The bounce initiated on April 7th accelerates, pushing the price back through the 6600 level and setting the stage for a retest of the 6900-7000 resistance area. A breakout above 7000 would then open the door for further all-time highs.
Consolidation Scenario (If 6400 Breaks): A break below the 0.236 Fib support shifts focus to the 6200/6123 zone. The market would likely enter a longer period of range-bound trading between ~6100 and ~6800 before gathering enough momentum for its next sustained move.
Conclusion:
In summary, while the S&P 500 faces clear overhead resistance following its rejection near 7000, the pullback is currently testing a critical support confluence near 6400. The bullish thesis for a "bounce back to 7000" is technically valid, but it is entirely contingent upon the index defending the 0.236 Fibonacci retracement level (6428.21) and the 6400 support zone. A trader should watch for confirmed bullish reversal signals (e.g., strong bullish engulfing candles, positive RSI divergence) at this level as the potential trigger for the next leg up.
Trade ideas

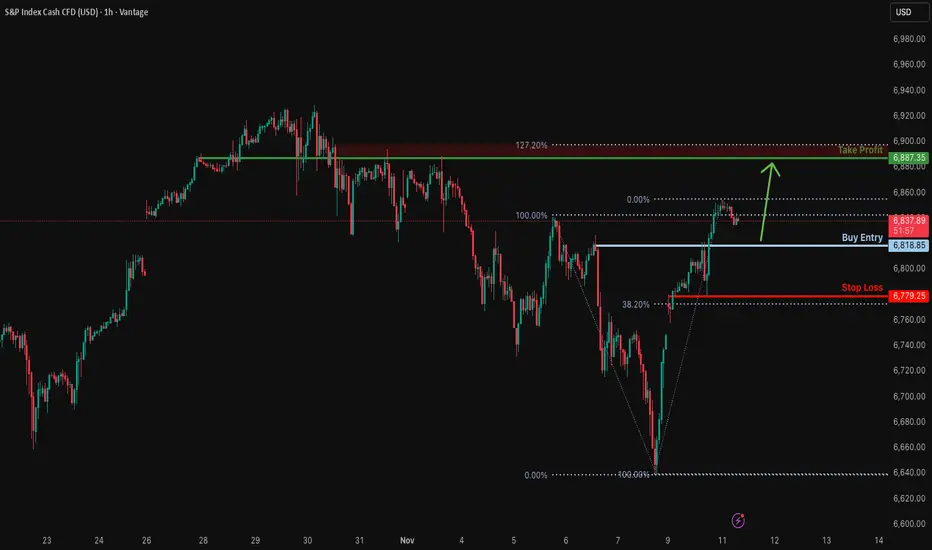
Bullish continuation setup?S&P500 is falling towards the support level, which is a pullback support and could bounce from this level to our take profit.
Entry: 6,618.85
Why we like it:
There is a pullback support level.
Stop loss: 6,779.25
Why we like it:
There is a pullback support that lines up with the 38.2% Fibonacci retracement.
Take profit: 6,887.35
Why we like it:
There is an overlap resistance that is slightly below the 127.2% Fibonacci extension.
Enjoying your TradingView experience? Review us!
Please be advised that the information presented on TradingView is provided to Vantage (‘Vantage Global Limited’, ‘we’) by a third-party provider (‘Everest Fortune Group’). Please be reminded that you are solely responsible for the trading decisions on your account. There is a very high degree of risk involved in trading. Any information and/or content is intended entirely for research, educational and informational purposes only and does not constitute investment or consultation advice or investment strategy. The information is not tailored to the investment needs of any specific person and therefore does not involve a consideration of any of the investment objectives, financial situation or needs of any viewer that may receive it. Kindly also note that past performance is not a reliable indicator of future results. Actual results may differ materially from those anticipated in forward-looking or past performance statements. We assume no liability as to the accuracy or completeness of any of the information and/or content provided herein and the Company cannot be held responsible for any omission, mistake nor for any loss or damage including without limitation to any loss of profit which may arise from reliance on any information supplied by Everest Fortune Group.
USA S&P 500 IndexPrice has completed a clean sweep of sell-side liquidity and is now showing strong displacement toward the upside. The recent break in structure confirms short-term bullish intent.
If price returns to the fair value gap or discount zone, I’ll look for confirmation to enter in alignment with the intraday bullish flow.
My first target remains the internal liquidity zone, and the potential extended target is the previous day’s high where buy-side liquidity rests.

Did You Buy The Dip? Heres What we bought!Today the SPX had an incredible morning selloff - met with and even more incredible rally.
The markets were in turmoil today up until the bulls stepped in and made a red to green reversal.
Days like today often create the biggest portfolio gains when you can buy stock at depressed levels.
We accumulated 6 position longs today.
Massive technicals were tested and defended today.

S&P 500: Multiple Bearish Signals AlignS&P 500 index chart shows multiple bearish signals on the weekly time frame
1. The price has hit the upside of the long-term uptrend and it was rejected
2. Bearish Reversal Evening Star Candlestick pattern appeared on the top
3. RSI has built the Bearish Divergence as it did not confirm the new peak
There are 3 support levels:
1. Double support of trend channel's mid-line and previous top around $6,147
2. Bottom of the channel between $5,300 and $5,400
3. "Die-hard" multiple support that was built since 2021 around $4,819
What are your thoughts?

SPX wedge breakout: Reopen relief, 6780 tetest, 7k in SightS&P500 breaks out of a broadening wedge and retests 6780 support as government reopening odds fuel a relief bid.
Senate progress towards ending the record shutdown has lifted the overhang on data releases and growth, triggering a risk-on bounce across US indices. Price action confirmed a breakout with a clean throwback to 6780, aided by hidden bullish divergence on momentum before the surge to 6850.
Key drivers:
Government reopening: bipartisan Senate advance and White House support shift odds towards a near‑term resolution.
Technical confirmation: breakout from falling/broadening wedge, successful retest and RSI reset from overbought at 6850 towards midline supports continuation higher if 50 line holds.
Levels in play: support 6800–6775 and 6750; resistance 6850–6890 then 6930 with psychological 7000 on extension if momentum rebuilds.
Risk: reopening unleashes delayed macro data. A miss or policy hiccup could pull the price back toward the 50% area before the trend resumes and ahead of Nvidia earnings next week.
Bias stays long while above 6775: buy dips to 6750 with invalidation below 6725; If 6690 fails on a daily close, step aside and reassess.

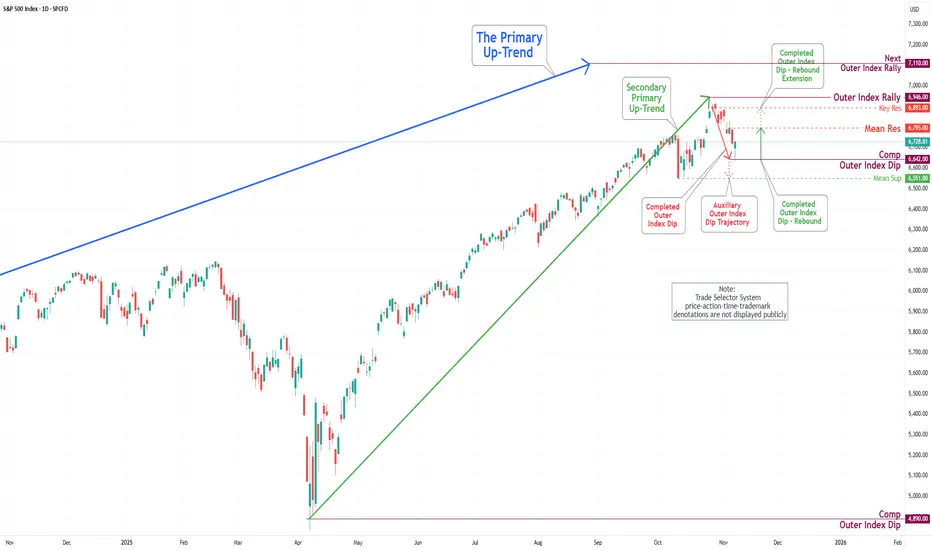
S&P 500 Daily Chart Analysis For Week of Nov 7, 2025Technical Analysis and Outlook:
During the recent trading session, the S&P 500 Index experienced a notable decline, underscoring the significance of our key target, situated at the Mean Support level of 6,740. The index has now completed the Outer Index Dip at 6,642. This positioning indicates the potential for further upward movement, with the target established at the Mean Resistance level of 6,795. The prevailing trend suggests a well-structured extension towards the Key Resistance level of 6,893, with an ultimate target for the Outer Index Rally set at 7,110.
Nevertheless, it is crucial to acknowledge the possibility of a substantial drawdown in the forthcoming week’s trading session. This may lead to a retest of the Outer Index Dip at 6,642, possibly resulting in a further decline to the Mean Support level at 6,551 before ultimately resuming an upward trajectory.
S&P 500 — The Market Cycle Nears Its Turning PointS&P 500 Technical Outlook — The Market Cycle Nears Its Turning Point
Market Overview
The S&P 500 Index continues to follow its recurring market cycle pattern, which typically spans around 10–12 months.
After an impressive rally since mid-2024 that pushed the index to a new high near 6,900, early signs now suggest that the market may be entering the late stage of its uptrend cycle.
Momentum indicators have started to weaken, and profit-taking pressure is emerging — both of which are common signals seen before a mid-cycle correction phase begins.
Technical Analysis
1. Major Trend
The yellow trend lines highlight two major upward waves in this cycle.
Each rally ended with a 10–15% correction before the next advance.
Currently, the index is showing signs of exhaustion near the 6,900 resistance zone — marking a potential top for this cycle.
2. Repetitive Cycle Behavior
The blue dotted arcs represent cyclical market behavior seen repeatedly over the past few years.
If history rhymes, a sharp sell-off could occur around mid-December 2025, forming the next cycle low.
The projected downside target lies near 5,800–5,900, which could act as the base for the 2026 recovery phase.
3. Key Levels to Watch
Resistance: 6,800 – 6,900
Intermediate Support: 6,200
Major Support (Cycle Low Zone): 5,800 – 5,900
Forecaster’s View
“The S&P 500 is likely entering a mid-cycle correction phase after reaching its recent peak.
A sharp decline around mid-December 2025 could mark the turning point before a new accumulation phase begins in 2026.”
Strategic Outlook:
Short-Term Traders: Focus on the 6,200–6,800 range; avoid chasing strength near resistance.
Medium- to Long-Term Investors: Prepare to accumulate near 5,800, which could represent a cycle bottom for this phase.
Cycle Followers: Watch for capitulation or panic-selling around mid-December 2025, often a precursor to the next bullish cycle.
Summary
The current S&P 500 structure demonstrates a clear cyclical rhythm — every deep correction has historically paved the way for the next strong expansion.
If the December sell-off unfolds as expected, 2026 could mark the start of a new major uptrend, turning short-term volatility into long-term opportunity for strategic investors.

SPX500 - 5000 & 5500 PUT, exp June 2026📉👍
SPX500 short with 5000 & 55000 PUT exp June 2026.
Take your pick...
AI hype & capital overcommitment
China beginning to catch up in GPU compute capability, pulling away capital from nvidia
Degrading consumer credit (BNPL, Auto loans, housing)
Increased govermant debt, geo-political decoupling
China rare earth mineral threats
Possible overturn on the Trumps tarrifs by the supreme court, requiring repatriations to be paid back to foreign countries

Evolution and Growth of the Hedge Fund Industry1. Origins of Hedge Funds (1940s–1960s)
The concept of hedge funds began in 1949 when Alfred Winslow Jones, a sociologist and financial journalist, launched the first modern hedge fund. Jones introduced the revolutionary idea of combining long and short positions to hedge against market fluctuations, aiming to reduce risk while maximizing returns. He also implemented performance-based fees, taking 20% of profits, a structure that became standard across the industry.
Jones’ approach—using leverage, short selling, and active management—distinguished his fund from traditional mutual funds, which were restricted by regulations and passive investment mandates. His strategy sought “absolute returns” regardless of market direction, laying the foundation for modern hedge fund philosophy.
Throughout the 1950s and 1960s, hedge funds remained relatively obscure, operating primarily as private partnerships for high-net-worth individuals. Their secrecy and exclusivity contributed to an aura of mystery that persists even today.
2. Expansion and Innovation (1970s–1980s)
The 1970s marked a period of economic volatility, including oil shocks, inflation, and market instability. These conditions provided fertile ground for hedge funds, which thrived on flexibility and alternative strategies. During this era, funds began to diversify beyond simple long-short equity plays into macro strategies, arbitrage, and event-driven investing.
The 1980s saw an acceleration of growth, largely driven by financial deregulation, advances in technology, and the rise of institutional investors. Hedge funds started attracting endowments and pension funds seeking diversification and higher returns. Managers like George Soros and Julian Robertson became iconic figures. Soros’ Quantum Fund famously made $1 billion by shorting the British pound in 1992, an event that showcased the power of hedge funds in global finance.
Hedge funds also began to operate across borders, benefiting from globalization and the liberalization of capital markets. Their ability to move swiftly in and out of markets made them powerful players in global finance, influencing currencies, interest rates, and stock indices.
3. Institutionalization and Mainstream Growth (1990s)
The 1990s were a turning point when hedge funds transitioned from exclusive private partnerships into an institutionalized investment industry. Large investors—such as university endowments, foundations, and pension funds—began allocating significant capital to hedge funds as part of diversified portfolios.
The proliferation of new strategies defined this decade. Hedge funds expanded into convertible arbitrage, fixed income arbitrage, global macro, distressed securities, and emerging markets. This diversification not only attracted new investors but also mitigated risks by spreading exposure across multiple asset classes.
The 1990s also brought increased attention to hedge funds’ impact on financial markets. The collapse of Long-Term Capital Management (LTCM) in 1998 highlighted both the sophistication and fragility of hedge fund strategies. LTCM’s use of massive leverage and complex derivatives led to a near-systemic crisis when markets turned against it. The U.S. Federal Reserve intervened to organize a bailout, illustrating hedge funds’ growing systemic importance.
Despite this setback, the industry continued to grow. Hedge funds became symbols of financial innovation and intellectual talent, often recruiting PhDs, mathematicians, and computer scientists to develop quantitative and algorithmic models that enhanced investment precision.
4. The Boom Years (2000–2007)
The early 2000s were the golden age of hedge funds. The industry’s assets under management (AUM) grew exponentially—from around $500 billion in 2000 to over $2 trillion by 2007. This growth was fueled by several factors:
Market turbulence following the dot-com crash increased demand for non-traditional investments.
Low interest rates and easy credit encouraged the use of leverage.
Institutional acceptance expanded, with funds-of-funds acting as intermediaries for smaller investors.
Globalization and technology enabled sophisticated strategies across markets and asset classes.
Hedge fund managers such as John Paulson, Ray Dalio, and David Einhorn became household names, with funds generating outsized returns. The diversity of strategies—from statistical arbitrage to credit default swaps—helped hedge funds outperform traditional asset classes.
However, the industry’s success also brought scrutiny. Critics argued that high fees, secrecy, and leverage created systemic risks. Regulators began exploring ways to increase transparency and oversight.
5. The Global Financial Crisis and Aftermath (2008–2012)
The 2008 global financial crisis was a defining moment for the hedge fund industry. Many funds suffered significant losses due to market collapses and liquidity freezes. However, hedge funds fared better than traditional asset managers overall, as their flexible strategies allowed quicker adaptation to market turmoil.
The crisis reshaped the industry in several ways:
Regulatory oversight increased, particularly through the Dodd-Frank Act in the U.S., which mandated registration, disclosure, and risk reporting.
Investor demands shifted toward transparency, liquidity, and risk management.
Fund closures and consolidations occurred as smaller or over-leveraged funds failed to recover.
Despite short-term setbacks, the post-crisis period laid the groundwork for a more stable, professionalized, and transparent hedge fund ecosystem.
6. Maturity and Technological Transformation (2013–Present)
In the 2010s and beyond, the hedge fund industry entered a mature phase marked by both stability and competition. Assets under management exceeded $4 trillion globally, with thousands of funds operating across diverse strategies.
The rise of quantitative funds and machine learning-driven strategies revolutionized the landscape. Firms like Renaissance Technologies, Two Sigma, and AQR Capital Management demonstrated how big data, artificial intelligence, and algorithmic trading could generate alpha with minimal human intervention.
Simultaneously, hedge funds faced new challenges:
Fee pressure due to underperformance relative to benchmarks.
Competition from passive investing (ETFs and index funds).
Demand for ESG (Environmental, Social, and Governance) integration as investors prioritized sustainability.
Regulatory constraints and increased compliance costs in multiple jurisdictions.
Yet, hedge funds continued to evolve. Many adopted hybrid models, blending traditional discretionary investing with automated systems. Others expanded into private credit, venture capital, and digital assets, reflecting their adaptive DNA.
7. Globalization and the Future Outlook
Today, hedge funds are an integral part of the global financial ecosystem. They operate across continents—from New York and London to Singapore and Hong Kong—serving a diverse investor base that includes sovereign wealth funds, pension funds, and family offices.
The future of hedge funds lies in innovation and adaptability. Artificial intelligence, blockchain, and decentralized finance (DeFi) are expected to reshape strategies, data analytics, and operational efficiency. Moreover, the increasing focus on sustainability and impact investing suggests a new generation of “green hedge funds” that align profit motives with ethical imperatives.
While traditional hedge fund models may face fee compression and rising competition, the industry’s agility ensures its relevance. The drive for alpha generation, risk diversification, and strategic flexibility remains the cornerstone of hedge fund success.
Conclusion
The evolution of the hedge fund industry—from Alfred Winslow Jones’ experimental partnership in 1949 to today’s global network of multi-strategy investment giants—illustrates a story of innovation, resilience, and adaptability. Each era brought unique challenges and transformations, from the intellectual revolution of long-short strategies to the data-driven frontiers of algorithmic trading.
Despite cyclical setbacks, hedge funds have consistently evolved to meet changing market conditions and investor demands. Their journey underscores a central truth: the pursuit of absolute returns and risk-adjusted performance will always attract investors seeking to outpace the market. The hedge fund industry, now a mature yet dynamic force, continues to shape the future of global finance—balancing secrecy with sophistication, and innovation with responsibility.

Markets Looking SOFT at highs - Correction Underway (Key Levels)October 10th candle is a very important low for all US Markets
-S&P
-Nasdaq
-Dow
-Russell
The rally from that Oct 10 candle low (Friday) was met with aggressive
support but was only showing rallies in Mag 7 and AI related plays
Earnings for the most part are coming in meeting or exceeding expectations, but
price action is certainly looking soft with the market making lower highs and lower
lows for now
We have plenty of technical support, but given the longest US Government Shutdown
in history with dot.com like valuations (there is bubble and non-bubble evidence),
sentiment and elevated volatility are taking their toll and dragging the markets lower
I've closed a lot of open positions and de-risked the portfolio pretty severely this week
with the intention of finding ways to participate in a cautiously bullish environment. As I mention in the video, markets tend to V bottom, but round out the tops so the longer we
stall at these highs and the more "rounded" look we have near these highs, the more
fragile and support can be if we eventually see a break lower - TBD
Day to day, we continue to do good work carving out short-term winners and properly
position for what is next - good or bad
Thanks for watching. See you in the live markets
-Chris

Update at 4pmAlthough the trade did not go my way today, I still expect a further move down. I'm incorrect if they get over the high from today. Gold also looks ready to test it's lows. Oil still consolidating above it's 18ma. BTC looks like a pullback is also coming, a further low is expected still.

SPX What's it Gonna Be? Pop or Drop?Fellow SPX traders, followers and gamblers!
Do we have a bullish flag on the 30min or will it fake break the other way?
Pop or Drop be ready either way!

Inverse Cup&Handle On 12hr SPX/USDFellow traders! We could have a Inverse Cup & Handle on the 12hr SPX.
This could also be a development of a H&S . Time will tell but for now I measured a move from the cup & handle and get a target of 6594.1
Chart patterns pop up we take action only when we get the break of a break line which in this case has happened so we pounce.
Best of luck in all your trades, see you at the finish line $$$

SPX500 Bullish Plan in Motion with SMA + Kijun Confirmation🚀 US500/SPX500 INDEX MARKET SWING TRADE MASTERCLASS 🎯
📊 ASSET: S&P 500 Index (US500 | SPX500)
Timeframe: 4H-Daily | Strategy Type: Swing Trade | Market Context: Bullish Pullback Confirmation
🎲 TRADE SETUP: THE "THIEF PROTOCOL" STRATEGY ⚡
✅ TECHNICAL CONFIRMATION
🔹 Primary Signal: Simple Moving Average (SMA) Pullback Retest
🔹 Secondary Confirmation: Kijun-sen (Ichimoku MA) Retest
🔹 Market Structure: Higher Lows Formation + Bullish Consolidation
🔹 Bias: LONG with Layered Entry Methodology
💰 ENTRY STRATEGY: MULTI-LAYER LIMIT ORDER APPROACH
The "Thief Layering Method" - Stack multiple buy limit orders for optimal risk distribution:
🟢 Layer 1 Entry: $6,750.00 - Initial Probe Entry (30% Position Allocation)
🟢 Layer 2 Entry: $6,800.00 - Aggressive Add (35% Position Allocation)
🟢 Layer 3 Entry: $6,850.00 - Final Confirmation Entry (35% Position Allocation)
Entry Flexibility: Adjust layers based on your account size & risk tolerance. Spread entries across pullback zones for superior fill pricing.
🛑 STOP LOSS MANAGEMENT
Recommended SL Level: $6,720.00 - Placed below the support trendline + SMA confluence
⚠️ IMPORTANT DISCLAIMER: Dear Traders! This is YOUR trading journey. We strongly recommend adjusting stop loss based on YOUR risk management rules. Account sizing is crucial - never risk more than 2-3% per trade. Your SL placement = YOUR decision, YOUR responsibility. Use proper position sizing ALWAYS.
🎯 PROFIT TARGET ZONES
Primary Target: $7,050.00 ⚡
📊 Technical Reasoning: This level represents strong resistance confluence zone, historical supply level in overbought territory, and creates a risk/reward sweet spot of 1:3+ return potential. Alert: Trap zone exists here - smart money reversal area confirmed.
Exit Strategy Recommendation: Close 50% of position at $7,000-7,020 to lock partial profits. Hold remaining 50% with trailing stop or until $7,050 for maximum upside capture. Lock profits incrementally to secure gains.
⚠️ CRITICAL REMINDER: Your profit target = YOUR choice! This TP represents technical confluence, but market conditions evolve. Trade YOUR plan, manage YOUR risk, protect YOUR capital.
🌍 CORRELATED PAIRS TO WATCH 🔗
📈 PRIMARY CORRELATIONS
1️⃣ QQQ (Nasdaq-100 ETF) - 0.99 Correlation 💻
This is the tech-heavy composition that typically leads SPX rallies. Current focus remains on AI/Mag7 momentum and overall growth stock sentiment. Key watch: QQQ strength = SPX bullish confirmation signal. When QQQ breaks out, SPX follows closely.
2️⃣ IWM (Russell 2000 ETF) - 0.95 Correlation 📍
Small-cap composition with high tariff sensitivity. Current status shows small-cap underperformance zones vulnerable to trade policy shifts. Trading tip: IWM weakness = Sector rotation risk, so watch for divergence from SPX strength.
3️⃣ DXY (US Dollar Index) - Inverse/Mixed Correlation 💵
Recent positive correlation emerging in 2025 market dynamics. Current dynamic shows dollar strength now sometimes supports equities due to policy-driven factors. Risk factor alert: DXY spike above 108 = potential SPX headwind to monitor.
📊 SECONDARY WATCH PAIRS
SPY (S&P 500 ETF) - Mirror of SPX, use for volume confirmation and institutional positioning.
DIA (Dow Jones ETF) - Large-cap value barometer, less tech-sensitive than QQQ, shows rotation signals.
VIX (Volatility Index) - Above 25 = caution mode, below 15 = complacency warning.
📱 KEY CORRELATION INSIGHTS FOR THIS TRADE
🔴 RED FLAGS - Watch These Closely:
VIX spiking above 30 signals potential fear spike. DXY breaking above 108 creates dollar strength pressure. QQQ failing to confirm breakout indicates tech weakness divergence. IWM hitting new lows signals broad market weakness.
🟢 GREEN LIGHTS - Trade Confirmation:
QQQ and SPX moving in sync above SMA is bullish. IWM holding key support levels confirms breadth. DXY consolidating means no headwind pressure building. VIX below 20 indicates low fear environment.
🎯 TRADE PSYCHOLOGY & EXECUTION TIPS
✅ Pre-Trade Checklist:
Confirm SMA pullback on 4H chart before entry. Verify Kijun retest on Ichimoku indicator. Check QQQ alignment for correlation confirmation. Monitor DXY to avoid strong dollar days. Set alerts at all 3 entry layers for execution readiness.
✅ During Trade Management:
Take partial profit at 50% move up to secure gains. Move SL to breakeven after hitting first target. Trail stop every 50-pip move in your favor. Document your execution for journal review and performance tracking.
🔥 TRADE EXECUTION SUMMARY
Signal Type: Bullish Pullback Retest ✅ Confirmed
Entry Method: 3-Layer Limit Orders 🎯 Optimized for Best Fill Pricing
SL Level: $6,720.00 🛑 Defined and Placed Below Support
TP Level: $7,050.00 🎯 Defined at Resistance Confluence
Risk/Reward Ratio: 1:3+ 💰 Favorable Trade Structure
Best Tradeable Window: Next 48-72 Hours ⏰ Active Setup Zone
Good Luck, Traders! 🚀 Trade Smart. Trade Safe. Trade Often.
Remember: Your SL = Your Protection | Your TP = Your Goal | Your Risk = Your Responsibility
#SPX500 #SwingTrade #TechnicalAnalysis #TradingIdea #S&P500 #MarketAnalysis #TradeSetup #RiskManagement

Battle at the 18maSPX futures gapped up and got to the 18ma area. If we close below the 18 today it would likely be bearish, and a close above would be likely bullish. There's a gap on futures which may get filled. Gold had a nice bounce but it's also testing it's 18ma resistance here. BTC is at resistance. Oil is holding support at around 60 dollars.

S&P500 H1 | Bullish Bounce off Key SupportMomentum: Bullish
Price is currently above the ichimoku cloud.
Buy entry: 6,811.61
- Pullback support
- 50% Fib retracement
- 100% Fib projection
Stop Loss: 6,773.85
- Swing low support
Take Profit: 6,848.7
- Overlap resistance
Stratos Markets Limited (tradu.com/uk ):
CFDs are complex instruments and come with a high risk of losing money rapidly due to leverage. 68% of retail investor accounts lose money when trading CFDs with this provider. You should consider whether you understand how CFDs work and whether you can afford to take the high risk of losing your money.
Stratos Europe Ltd (tradu.com/eu ):
CFDs are complex instruments and come with a high risk of losing money rapidly due to leverage. 70% of retail investor accounts lose money when trading CFDs with this provider. You should consider whether you understand how CFDs work and whether you can afford to take the high risk of losing your money.


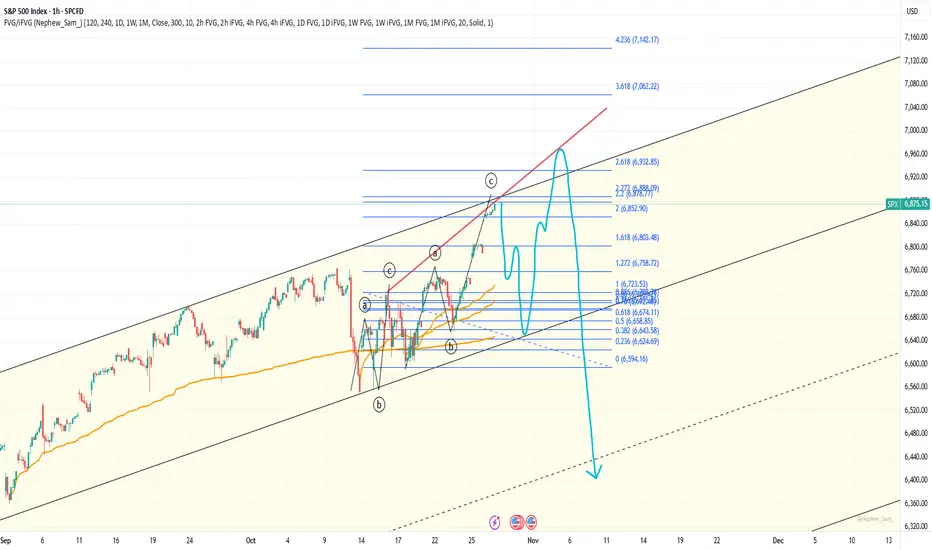
Ending expanding diagonal scenarioJust a possible scenario. If I'm right, wave 3 ends here, and wave 4 correction should start very soon.
Reversal?Channel resistance reached
RSI resistance reached
Double 1D divergence on RSI
If something ugly is gonna happen, it's gonna happen now.
Fib levels to watch:
1.272 - likely bounce area
1.618 - classic reversal level for a correction after wave 5, but I don't see strong support there
2.0 - not a fib level, but February peak is there. Likely bounce area.
2.2 and 2.272 area - when 1.618 level breaks, price usually reaches it. They are all inside of 1M FVG. The correction can end there. Or not.
2.618 - the price can reach and overshot it. Another 1M FVG lies just below it.
All 2+ fibs match previous peaks very good. Sounds crazy, but a correction to 6000 area seems very probably now.

S&P500 H1 | Bullish Bounce off Key SupportMomentum: Bullish
Price is currently within the bullish ichimoku cloud.
Buy entry: 6,817
- Strong overlap support
- 23.6% Fib retracement
- 127.2% Fib extension
Stop Loss: 6,774
- Swing low support
Take Profit: 6,874
- Swing high resistance
Stratos Markets Limited (tradu.com/uk ), Stratos Europe Ltd (tradu.com/eu ):
CFDs are complex instruments and come with a high risk of losing money rapidly due to leverage. 70% of retail investor accounts lose money when trading CFDs with this provider. You should consider whether you understand how CFDs work and whether you can afford to take the high risk of losing your money.
Stratos Global LLC (tradu.com/en ): Losses can exceed deposits.


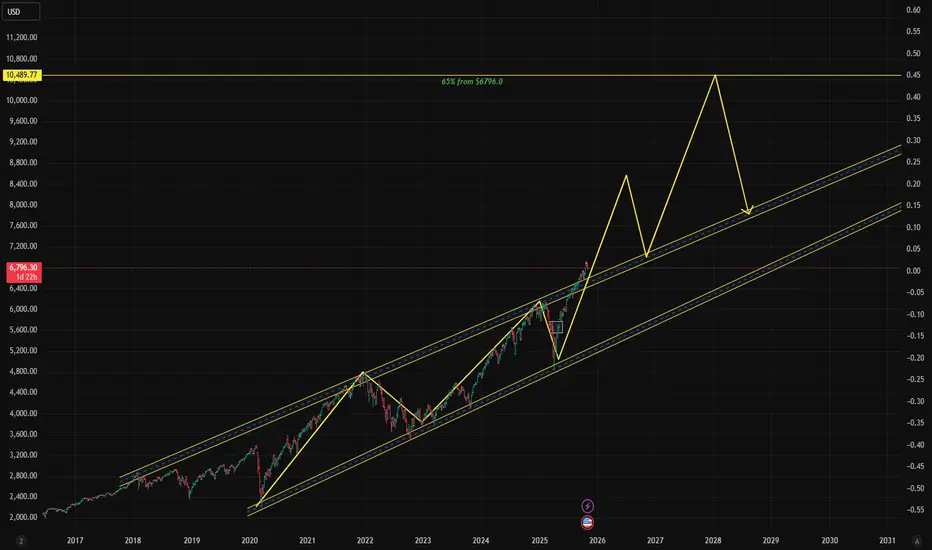
$SPX Hi, we are back with another one: SP:SPX !!!
As we can see we have SP:SPX sitting at $6796.30 with and expectation for a 65% pump.
That would bring us around $9-$10K per 1 SP:SPX .
Wouldn't that be incredible if we can see this by 2026 -2028 ?
What a time to be alive no ?
Don't forget to comment like and share for good luck :) !!!