US Stocks Pare Back All Tariff-Fueled Losses. Are We So Back?Remember “Liberation Day”? The one that felt more like Liquidation Day ? When markets tanked, tickers turned red, and you were afraid to check the markets on the next day? Well, turns out the rumors of the market’s demise were — once again — greatly exaggerated.
If the average recession 10 years ago lasted two years, this year’s recession was approximately 37 minutes (more or less, depending on the day).
Just a month ago, the S&P 500 SP:SPX started crumbling to the point it entered into correction territory (and then got out of correction territory ).
Long story short, it took the punches, went down 15%, stood back up, and is now throwing jabs with a nine-day winning streak — its longest since 2004, when iPods were still a thing and Facebook was just for Harvard students.
So… are we back? Like, really back? Let’s dig in.
💰 Trillions Lost, Trillions Found
On April 2, President Donald Trump dropped the hammer — or rather, the online post — unveiling his “reciprocal tariffs,” which, in true Trumpian fashion, sounded equal parts policy and promo PR.
Markets didn’t take it well. Global stocks collectively threw a tantrum. The S&P 500 dropped like it had a brick in its pocket . Financials cratered, energy took a gut punch, and tech? See for yourself — we don't want to talk about it .
But now? The dip buyers are shopping up, scooping up, snapping up everything from banks to oil stocks to beleaguered megacaps. Suddenly, all those stock discounts look like missed opportunities, and the cash-on-the-sidelines traders are jumping in.
👌 Jobs Data: Not Too Hot, Not Too Cold
Friday was a good day. Why? Because April’s nonfarm payrolls ECONOMICS:USNFP report came in at 177,000 jobs — not too strong to trigger Fed-tightening fears, not too weak to imply economic decay. It was the goldilocks print.
The number was a drop from March’s revised 185,000, but what mattered was the beat: economists had pencilled in just 135,000. Markets took that as permission to throw a party.
The S&P 500 jumped 1.5%, reclaiming the level it had before Trump’s tariff tirade and putting an emphatic end to the selloff. Nine green days in a row? That’s a bull flex Wall Street hasn’t seen in two decades.
💥 Truth Social Posts That Move Markets
Not to be left out of the celebration, Trump hopped onto Truth Social with his usual caps lock enthusiasm:
“THE FED SHOULD LOWER ITS RATE!!!”
Sounds familiar?
Still, even without a rate cut (for now), the market got what it wanted: signs that the US labor market isn’t collapsing, trade talks might be back on the table, and the economy hasn’t lost its way.
😌 A Global Sigh of Relief
While the US led the rally, global markets also joined the rebound chorus. China’s commerce ministry chimed in Friday, saying Washington had expressed a “desire to engage in discussions.” In market-speak, that translates to: "Everyone calm down — we might not blow this up after all."
It doesn’t take much to change sentiment. A tweet here, a headline there, a hint of diplomatic progress — suddenly risk appetite returns and everyone forgets they were panic-selling just three weeks ago.
But don’t go lining up the espresso martinis just yet — not everything is fully recovered. The US dollar, for example, remains nearly 4% below its pre-tariff-announcement level.
🤔 We Are So… Back?
So are we officially back? Short answer — “put the word out there that we back up” for now . Markets are up, volatility is down, and everyone’s pretending they didn’t sell the dip at the worst possible time.
But — and you knew there’d be a “but” — caution still applies. Trade tensions aren’t over. The next Trump post could shake things again. The Fed hasn’t made its next move (that’s coming this Wednesday). And geopolitics remains a powder keg.
Still, what this rebound tells us is clear: the market has resilience. Maybe not logic. Maybe not grace. But resilience? Yes.
It also reminds us that trying to time news-driven selloffs is a dangerous game. Often, the best trades happen when fear peaks and everyone else is running for the hills.
👉 Final Thoughts: Watch the Calendar, Not the Chaos
The key takeaway from this tariff-to-rally rollercoaster? Markets can move fast — but they can also recover faster. If you panicked, you probably sold low. If you stayed focused, checked the earnings calendar , and remembered that market narratives shift like wind direction, you're probably doing well right now.
We’re so back — for now. But stay sharp. This market may have nine lives, but it also has the attention span of a toddler.
Your move : Did you ride the dip? Buy the bounce? Or just mute the chaos and sip your coffee? Drop your best “Liberation Day to Redemption Rally” trade below.
SPIUSD trade ideas

S&P 500 Bearish Reversal Setup: Short Entry Below Key ResistanceEntry Point: Around 5,678.79
Stop Loss: Around 5,833.61 (above recent resistance zone)
Target Point: Around 4,831.37 (indicating a bearish target)
2. Technical Patterns:
The price hit a resistance zone (highlighted in purple) and reversed—this is often a bearish signal.
The trendline break (marked with the orange dot and blue arrow down) suggests a potential trend reversal.
The moving averages (likely 50 EMA and 200 EMA) indicate the price is still above the support zone but weakening.
3. Risk/Reward Ratio:
Risk (Stop Loss – Entry): ~154.82 points
Reward (Entry – Target): ~847.42 points
Risk/Reward Ratio: Approximately 1:5.5, which is favorable for shorting.
4. Trade Sentiment:
Bearish bias based on the breakdown from the resistance zone and confirmation from chart patterns.
If the price fails to hold above 5,682.87, a short trade may be validated with the target at 4,831.37.

SPX Bullish Breakout and Wave 5 TargetSPX has successfully broken out of the rounding bottom pattern, confirming a strong bullish reversal. After completing waves 1 to 4 within the upward channel, the index is now poised to advance into Wave 5.
The current momentum supports a rally toward the immediate setup target near 6,690, with an ideal continuation into Wave 5. A decisive breach of this resistance could accelerate the move toward the mid-term target around 7,278, activating a new bullish impulse.
The chart highlights key support in the buy zone and emphasizes the importance of a confirmed breakout, offering a high-probability setup aligned with the Wave progression and ongoing trend strength.

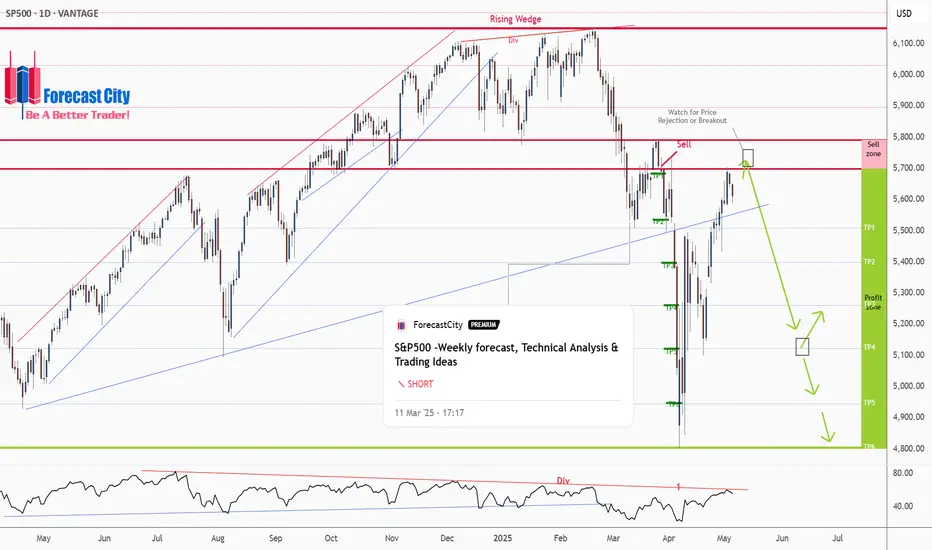
S&P500 -Weekly forecast, Technical Analysis & Trading IdeasPrevious forecast result:
As you can see in the 4CastMachine forecast on 12/03/2025, the price, after rejecting the sell zone, began its sharp decline and touched all TPs.
Midterm forecast:
While the price is below the resistance 6149.57, resumption of downtrend is expected.
We make sure when the support at 4804.01 breaks.
If the resistance at 6149.57 is broken, the short-term forecast -resumption of downtrend- will be invalid. CSEMA:S&P
Technical analysis:
While the RSI downtrend #1 is not broken, bearish wave in price would continue.
A trough is formed in daily chart at 4807.10 on 04/07/2025, so more gains to resistance(s) 5698.65, 5791.00, 5896.50 and maximum to Major Resistance (6149.57) is expected.
Price is above WEMA21, if price drops more, this line can act as dynamic support against more losses.
Relative strength index (RSI) is 55.
Take Profits:
5509.32
5363.90
5261.00
5122.47
4944.41
4804.01
__________________________________________________________________
❤️ If you find this helpful and want more FREE forecasts in TradingView,
. . . . . . . . Hit the 'BOOST' button 👍
. . . . . . . . . . . Drop some feedback in the comments below! (e.g., What did you find most useful? How can we improve?)
🙏 Your support is appreciated!
Now, it's your turn!
Be sure to leave a comment; let us know how you see this opportunity and forecast.
Have a successful week,
ForecastCity Support Team
S&P 500 records 9 days of gains, longest streak in 20 years🚨S&P 500 records 9th consecutive day of gains, the longest winning streak in over 20 years..
🚨
MartyBoots here , I have been trading for 17 years and sharing my thoughts on ETH here.
SP:SPX
Watch video for more details

Today is oct 14th 1929 I have moved back to Long puts at 105%The chart posted was in the forecast written dec 8th 2024 We have now reached my targets of 5669 area I have been buying the dips in calls and made $ I am now 105 % long in the money puts and I do Not see a bottom until july once we break and a second bottom mid oct The market should see a drop of 38 % into july and form a small double bottom in oct at 41 % off the highs . I will move to 125 % long puts on a sell stop at 5300 even the math at 5334 is key Best of trades WAVETIMER

Down for SPX500USDHi traders,
Last week SPX500USD did not close below the Daily FVG and broke the Weekly FVG. Now the trend has changed to bullish but price is moving very slow. This could indicate a leading diagonal (wave 1).
So next week we could see a (corrective) move down from the Daily FVG above.
Let's see what the market does and react.
Trade idea: Wait for price come into the Daily FVG above and a change in orderflow to bearish, a small impulse wave down and a small correction up on a lower timeframe to trade (short term) shorts.
If you want to learn more about trading FVG's & liquidity sweeps with Wave analysis, then please make sure to follow me.
This shared post is only my point of view on what could be the next move in this pair based on my technical analysis.
Don't be emotional, just trade your plan!
Eduwave

Looking for One More High So far, our minor B wave price action has not thrown us any curveballs, which is somewhat unusual considering B waves can become very complex. As I get into the micro price action, this pattern would fit better completed with at least one more high.
Nonetheless, I will offer a warning, we are in the target box...if you are long, please use stops, and make sure your position size is risk managed.
Best to all,
Chris

S&P500 Short Update: Break of TrendlineThis is an update to my short idea 2 days ago. I believed that the reversal for S&P500 has already begun and that I expect a move down from the breaking of the lower trendline.
Apologies for the audio as I am testing out a new setup (with a new portable microphone).

Elliott Wave Framework Highlights S&P 500 (SPX) Bullish ImpulseThe S&P 500 ( SP:SPX ) has shown significant correction since its peak on February 17, 2025, before a tariff announcement. We propose that the corrective phase, labeled as wave (II), concluded at 4823. However, for the index to confirm the end of this correction and rule out a potential double correction, it must surpass the prior wave (I) high of 6147.43. Since the wave (II) low, the SPX has embarked on an upward trajectory, characterized as a nesting impulse—a pattern where waves build momentum in a structured, upward climb.
From the wave (II) low, the rally began with wave 1 peaking at 5246.57, followed by a pullback in wave 2 to 4910.42. The index then surged in wave 3, which is unfolding in a five-wave impulse pattern on a smaller degree. Within wave 3, the first sub-wave ((i)) reached 5456.9, with a dip in wave ((ii)) to 5101.63. The index climbed again in wave ((iii)) to 5700.7, followed by a minor pullback in wave ((iv)) to 5578.64. We anticipate the index will extend higher to complete wave ((v)) of 3, followed by a wave 4 correction. Then the Index should do one final push to finish wave 5 of (1). After this, a broader correction from the April 7, 2025 low is expected in wave (2) before the uptrend resumes. As long as the 4823.5 pivot holds, any near-term pullbacks should find support in a 3, 7, or 11-swing pattern, paving the way for further gains. This analysis, rooted in Elliott Wave theory, suggests a bullish outlook for the SPX in the near term, provided key support levels remain intact.

SP500. Time to resume the downtrend? Latest observations on the SP500: Despite recent upward movements, I continue to view both SP500 and Oil as being within broader correlated downtrends.
The recent price action likely represents a corrective phase rather than a reversal.

The channels are everything We are bouncing around inside the channels. Its very possible we break up from this area, in which case the target will be the bollinger band at 5770 area. If we break down overnight for some reason it will be a large move down. It's difficult to say what will happen, but the channels right now are key to the price action.

SHORT ON SPYNice Double Top at a Major supply zone on spy.
I will be selling spy to the next demand zone for almost 900 points. (INSANE)

The Relief Rally is at ResistanceThe SPX touched the main support line, it bounced after the "Buy the Dip" setup until it reached the S/R level at 5,600. This level is at the end of the relief rally, and we can say we're "back to normal".
However, this is a critical point where this support was broken in the past and since support turns into resistance when broken, the most probably price action is a retracement back to the main support line, where depending how the market interprets the Fed Decision it may create a bounce and we can expect it to be consolidating in a trading range.
The main S/R trading range becomes , and if the market gains enough momentum, it could jump to the upper trading range .
It is not likely that the Fed will lower interest rates, since the effects of Tariffs is yet to be known. Inflation has been kept in check since the "soft landing", currently at 2.40%. Lowering interest rates now without knowing the collateral damage of tariffs would be a wild bet.

S&P500 - The bottom we have been waiting for!The S&P500 - TVC:SPX - officially created the bottom:
(click chart above to see the in depth analysis👆🏻)
This month we officially saw one of the craziest stock market fakeouts of the past decade. With a drop and reversal rally of about +15%, the S&P500 is about to even close with a green monthly candle, which then indicates that the stock market bottom was created.
Levels to watch: $120, $250
Keep your long term vision!
Philip (BasicTrading)

Hellena | SPX500 (4H): LONG to resistance area of 5682.Colleagues, I think that the deep downward movement is over and at the moment I expect an upward movement in a five-wave impulse. At the moment I expect a correction in wave “2” to the area of 5100, after which I expect the development of wave “3” at least to the resistance area of 5682.
There are two possible ways to enter the position:
1) Market entry
2) Pending Limit Orders.
Manage your capital correctly and competently! Only enter trades based on reliable patterns!

S&P500 pending short: wave 5 of 5 of C or ZThis is how I will count the S&P500 Elliott waves.
Entry will be at 5757.5. You can wait to a reversal signal instead also. Stop above the high if that's what you choose. Else, give some space. I'll set the stop nearer to 5800.

S&P500: Hit its 4H MA50. Can it provide a price push?S&P500 (SPX) is neutral on its 1D technical outlook (RSI = 52.949, MACD = 19.450, ADX = 31.038) as the index just hit its 4H MA50, which is holding since April 22nd. This is at the bottom of the 4H Channel Up so as long as it holds, the signal is bullish. In the meantime the index again hit the P1 level, which was previously a Resistance. As long as this demand zone holds, we are aiming at the R2 level (TP = 5,790).
## If you like our free content follow our profile to get more daily ideas. ##
## Comments and likes are greatly appreciated. ##

The High of BalanceWe are at the high of the balance area after they ended the day yesterday inside the white channel. My feeling is they will try to take out stops around 5720-5730 and reverse.

S&P 500 - Sell in May, return anther day. The truth - 2025No doubt everyone has heard a variation of the phrase:
“Sell in May, return another day.”
In Wikipedia it is written:
“Sell in May and go away is an investment strategy for stocks based on a theory (sometimes known as the Halloween indicator) that the period from November to April inclusive has significantly stronger stock market growth on average than the other months. In such strategies, stock holdings are sold or minimised at about the start of May and the proceeds held in cash”
A public comment from last year:
“Over 100 years ago, the (practical) reason to sell in May and September, was to pay seasonal workers to seed the field (May) and to harvest (September). Caravans of landlords and farm owners went to New York to sell stocks and withdrew money from the banks to do payrolls
so for people without agricultural business, i'll say it's okay to hold in May”
If we are to take all this at face value then we should be unwinding our long term positions until the Autumn?
What does the chart say?
On the above monthly chart of the S&P 500 each vertical line marks the month of May going back to 2012. That is a dataset of 13 points.
The facts:
1) From the month of May onwards, 11 from 13 periods returned positive price action of not less than 10%. Selling in May was a bad choice.
2) 2015 and 2022 saw corrections of 15% from May onwards. However in both examples the correction was erased within 12 months as the index continued the uptrend.
In summary, 86% of the time a minimum return of 10% was seen before the year end. Amazing odds.
Furthermore, corrections up and until the end of April (like we’re now seeing) represented some of the best long opportunities.
Sell in May go away? I suggest it should be: Buy in June and watch it boom!
Ww

Whipsaw Fridaymarket is gearing up for a larger move down in my opinion, but one more whipsaw to finish looks likely today. I expect a move down and then a strong rally to finish the final wave 5.

11am updateWe had a rally from the channel, but right now I believe it's a correction of the first wave down. Above 5660 and it will likely mean we are headed to 5700+
I'm out for the day - good luck!

S&P500 Stuck between the 1D MA50 and 1D MA200.The S&P500 index (SPX) is now on a short-term correction following the impressive recovery of the last 30 days that made it almost test its 1D MA200 (orange trend-line). This is a technical rejection but the fact that the 1D MA50 (blue trend-line) is now the Support can be encouraging.
The reason is that since January 2023, every time the index broke above its 1D MA50 it turned into a Support that held and produced an immediate bullish extension on every occasion except for one time (Sep 2024), which still recovered 1 week after.
As a result, it is more likely for SPX to test its All Time High (ATH) by July than entering a long-term correction again.
-------------------------------------------------------------------------------
** Please LIKE 👍, FOLLOW ✅, SHARE 🙌 and COMMENT ✍ if you enjoy this idea! Also share your ideas and charts in the comments section below! This is best way to keep it relevant, support us, keep the content here free and allow the idea to reach as many people as possible. **
-------------------------------------------------------------------------------
Disclosure: I am part of Trade Nation's Influencer program and receive a monthly fee for using their TradingView charts in my analysis.
💸💸💸💸💸💸
👇 👇 👇 👇 👇 👇
