SPX500 (4H) LONG POSITIONGreeting there traders this is my idea on SP500 and it is Long.
We can clearly see a recovery from the “Support Area” (yellow zone), after a wave formation (probably a completed Elliott Wave correction).
You are currently in a very impulsive uptrend.
Momentum looks strong, with no major retracements — meaning that buyers would currently be in a dominating position.
Key Levels
Support Level (red): 5.019 – 5.091
This is the “ultima ratio” zone where the price made a strong rebound.
Softer Support: 5.276 – 5.282 (where you are now)
This is the zone of possible correction, as you marked.
Resistance/Target: 6.150 – 6.156
If the current trend holds and there is no major retracement below 5,250, it is very likely that we will test the 6,000–6,150 level in the coming days.
The price is currently in a “blast-off” phase — if volume remains strong, you can hit the TP as early as late April or early May.
I predict that we have started an uptrend towards a new ATH. I believe that the market will start to "fly" already on Monday or Tuesday. Possible catalysts: Trump strikes a deal with China, announces a pause in the trade war, or Powell responds with an emergency rate cut.
My goal is mid $6,000 to low $7,000 by July 4th (maybe sooner). After that I expect a 60-70% drop.
SPIUSD trade ideas

S&P500: Buying accelerating as the bottom is confirmed.S&P500 is neutral on its 1D technical outlook (RSI = 52.628, MACD = -41.490, ADX = 32.588) as it has been volatile during the day but on the long-term, it has resumed the bullish trend, making a strong recovery last week. The bottom is now confirmed (above the 1W MA200) and as the oversold 1W RSI was bought, the index eyes a +28.50% rise on the medium term, same as in early 2024. This falls practically on the previous ATH level (TP = 6,150).
## If you like our free content follow our profile to get more daily ideas. ##
## Comments and likes are greatly appreciated. ##

S&P 500 correction before the global fall.S&P 500 correction before the global fall of the usa stock market.
Hey traders! I’m sure many of you have noticed that after the introduction of retaliatory tariffs, the markets started getting pretty choppy.
The S&P 500 took a serious dive.
• On the weekly chart, I’ve marked a support level + the 161.8% Fibonacci level, where we might see a bounce back to the $5680–$5800 range.
• But from there, I think we could see the start of a major crash—both in equities and crypto—that could last 1–2 years.
• Based on my estimates, the S&P 500 could drop back to 2020–2021 levels, a wide range of 2200–3000.
• For Bitcoin, we’re talking around $5000; for Ethereum, $100–$300; and for Solana, $2–$12.
3D Chart:
3W Chart:
Real-world events that could tank the stock market this hard:
Global Recession: If major economies (US, China, EU) slide into a recession at the same time—think trade wars, rampant inflation, or a debt crisis—investors will dump risky assets like hot potatoes.
Trade War Escalation: Harsher tariffs between the US and China/EU could wreck supply chains, crush corporate earnings, and spark a full-on market panic.
Geopolitical Conflict: A big blow-up—like a full-scale war or crisis (say, Taiwan or the Middle East)—could send capital fleeing to safe havens (gold, bonds), while stocks and crypto get slaughtered.
Collapse of a Major Financial Player: If a big bank or hedge fund goes bust (Lehman Brothers 2.0-style) due to an overheated market or bad debt, it could trigger a domino effect.
Energy Crisis: A spike in oil/gas prices (from sanctions or conflicts, for example) could kneecap the economy and drag risk assets down with it.
Market Bubble Burst: If the current rally turns out to be a massive bubble (and plenty of folks think it is), its pop could pull indexes down all on its own.
Looming Wars: A potential Russia-Europe war starting as early as 2025, or an Iran-Israel conflict that drags in multiple nations, could destabilize global markets, spike energy prices, and send investors running for the exits.

sp500A strong entry of buyers into the area. We will wait for it to return to the area we specified. Therefore, we are waiting for the price to come to an area, but if it does not come, we are not surprised because we expected a rise without a correction.

Another reversal 5600 now likelyWe came down to the top of the previous range and with the RSI as low as it got, the chances for reversal was high. I took profits and reversed long. I am now expecting 5600 and the 50 ma to finally get reached.

SPX - LONGprice is moving well with trade talks easing and agreements potentially coming into place. I believe price will continue this bullish momentum

Believe or Not- Blue SeasonBefore Donald Trump gets credit based on tariff's or anything like that I wanted to share the future of SPX 500 with everyone. It's definitely about to explode to a new all time high. Watch and learn. Market 101- Let's go USA!

The SPX Sell Off at 5500Hi all,
It has been a while since we posted as we waited for a really good trade setup. The SPX is hovering at 5500 and we believe it is the right level to sell.
1) There is a shark pattern at this level
2) RSI is overbought on every time frame except H4 and D1
3) There are smaller patterns to sell
4) There is very strong structural resistance at 5510 to 5520
The first target will be 5306 which has a great risk to reward of 1:5.
We will wait for M15 divergence and a trend line break to enter.

SPY/SPX500: Bearish Setup Ahead of Key Macro Events🔍 15-Min Chart Analysis – April 30, 2025
The S&P 500 (SPX500) is currently facing resistance near the 5,560.65 zone, a confluence of a key Fibonacci level (0.382 retracement) and a rising wedge upper boundary. Price has shown signs of rejection after a recovery from the ORB low of 5,505.88, and is struggling to break above 5,557–5,560, which aligns with a prior supply zone.
🔧 Technical Breakdown:
Bearish Rising Wedge Formation: Price is respecting the wedge trendlines, suggesting a potential breakdown.
Fibonacci Confluence Zones:
Resistance: 0.382 at 5,557.18
Support: 1.382 extension aligns with 5,508.75, which is just above the ORB low and a possible target.
Short Bias Trigger: A clean break below the wedge support (~5,545) could accelerate downside.
Target Zones:
🎯 First target: 5,524.39 (ORB low)
🎯 Second target: 5,508–5,505 area (Fibo 1.382 + ORB range support)
🔮 Probability Outlook:
Bearish bias: 65%
Bullish breakout: 25%
Sideways consolidation: 10%
🧠 Macro Context:
With U.S. GDP and FOMC decisions imminent, volatility is expected to spike. A break below wedge support could trigger a retracement toward key support zones. Be cautious of false breakouts as macro catalysts come into play.
📌 Watch the 5,545 level closely. Rejection + volume drop = high-probability short setup.

S&P 500 ChartSupport, Resistance, Trendlines.
Not a recommendation to buy or sell the market. For informational purposes only.

Buy Fear, Not Euphoria: The Trader's EdgeWhen you look back at the greatest trading opportunities in history, they all seem to share a common element: fear. Yet, when you're in the moment, it feels almost impossible to pull the trigger. Why? Because fear paralyzes, while euphoria seduces. If you want to truly evolve as a trader, you need to master this fundamental shift: buy fear, not euphoria.
Let's break it down together.
________________________________________
What Fear and Euphoria Really Mean in Markets
In simple terms, fear shows up when prices are falling sharply, when bad news dominates the headlines, and when people around you are saying "it's all over."
Euphoria, on the other hand, is everywhere when prices are skyrocketing, when everyone on social media is celebrating, and when it feels like "this can only go higher."
In those moments:
• Fear tells you to run away.
• Euphoria tells you to throw caution to the wind.
Both emotions are signals. But they are inverted signals. When fear is extreme, value appears. When euphoria is extreme, danger hides.
________________________________________
Why Buying Fear Works
Markets are pricing machines. They constantly adjust prices based on emotions, news, and expectations. When fear hits, selling pressure often goes beyond what is rational. People dump assets for emotional reasons, not fundamental ones.
Here’s why buying fear works:
• Overreaction: Bad news usually causes exaggerated moves.
• Liquidity Vacuums: Everyone sells, no one buys, creating sharp discounts.
• Reversion to Mean: Extreme moves tend to revert once emotions stabilize.
Buying into fear is not about being reckless. It’s about recognizing that the best deals are available when others are too scared to see them.
________________________________________
Why Chasing Euphoria Fails
At the peak of euphoria, risks are often invisible to the crowd. Valuations are stretched. Expectations are unrealistic. Everyone "knows" it's going higher — which ironically means there's no one left to buy.
Chasing euphoria often leads to:
• Buying high, selling low.
• Getting trapped at tops.
• Emotional regret and revenge trading.
You’re not just buying an asset — you're buying into a mass illusion.
________________________________________
How to Train Yourself to Buy Fear
It's not enough to "know" this. In the heat of the moment, you will still feel the fear. Here's how you build the right habit:
1. Pre-plan your entries: Before panic strikes, have a plan. Know where you want to buy.
2. Focus on strong assets: Not everything that falls is worth buying. Choose assets with strong fundamentals or clear technical setups.
3. Scale in: Don’t try to catch the bottom perfectly. Build positions gradually as fear peaks.
4. Use alerts, not emotions: Set price alerts. When they trigger, act mechanically.
5. Remember past patterns: Study previous fear-driven crashes. See how they recovered over time.
Trading is a game of memory. The more you internalize past patterns, the easier it is to act when everyone else panics.
________________________________________
A Recent Example: April 2025 Tariff Panic
Very recently, at the start of April, Trump’s new tariff announcements sent shockwaves through the market. Panic took over. Headlines screamed. Social media was flooded with fear.
But if you looked beyond the noise, charts like SP500 and US30 told a different story: the drops took price right into strong support zones.
At the time, I even posted this : support zones were being tested under emotional pressure.
If you had price alerts set and reacted mechanically, not emotionally , you could have bought into that fear — and potentially benefited from the rebound that followed just days later.
This is the essence of buying fear.
________________________________________
Final Thoughts
In trading, you are paid for doing the hard things. Buying when it feels terrible. Selling when it feels amazing.
Remember:
Fear offers you discounts. Euphoria offers you traps.
The next time the market feels like it's crashing, ask yourself:
• Is this fear real, or exaggerated?
• Is this an opportunity hiding under an emotional fog?
If you can answer that with clarity, you're already ahead of 90% of traders.
Stay rational. Stay prepared. And above all: buy fear, not euphoria.
Disclosure: I am part of Trade Nation's Influencer program and receive a monthly fee for using their TradingView charts in my analyses and educational articles.
US500 TRADE IDEAhi again
The US500 has shown strength by breaking the resistance at 5483.5 and is now at 5535. If the price reaches 5604.6 and a pullback occurs, targeting a temporary decline at the 50% Fibonacci retracement level is a good strategy.
Fibonacci retracement is often used to identify potential support and resistance levels where the price might pause or reverse. The 50% level is one of the commonly watched levels by traders as it often indicates a significant turning point in price movement.
good luck all
**My trading strategy is not intended to be a signal. It's a process of learning about market structure and sharpening my trading my skills also for my trade journal**
Thanks a lot for your support

S&P 500 ,,, Update chartTrending possibility
As I mentioned in a previous analysis, the chart reacted to a strong support zone with a significant bullish candle, indicating an emotional response. This was followed by a small correction. One encouraging sign suggesting a potential move into the green zone is the considerable buying volume observed at the support level, potentially signaling the end of this correction.
According to my strategy, identifying a new uptrend involves breaking a descending trend line and moving decisively above a major level, such as 5500 on this chart. Therefore, if a strong bullish candle forms and closes above this key level, I will consider initiating new long positions.
It's crucial to remember that consistent success in this market relies on having a clear strategy and adhering to it diligently.
Good luck.

Mixed signals in the MarketBoth the market and VIX are showing bullish and bearish signals. I try to explain what the possibilities are if we - rally higher, or sell down below 5550. Good luck

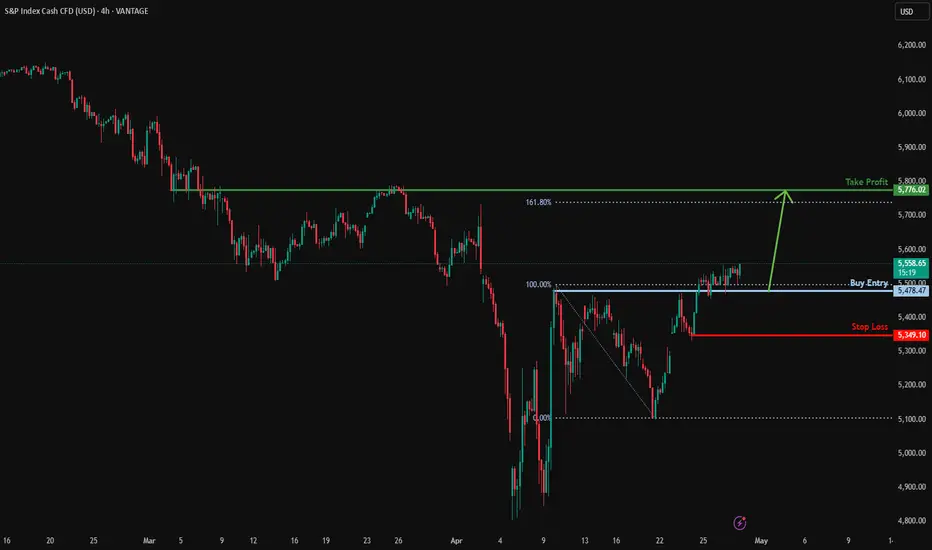
Bullish rise off pullback support?S&P500 has reacted off the support level which is a pullback support and could potentially rise from this level to our take profit.
Entry: 5,478.47
Why we like it:
There is a pullback support level.
Stop loss: 5,349.10
Why we like it:
There is a pullback support level;
Take profit: 5,776.02
Why we like it:
There is a pullback resistance level that is slightly above the 161.8% Fibonacci extension.
Enjoying your TradingView experience? Review us!
Please be advised that the information presented on TradingView is provided to Vantage (‘Vantage Global Limited’, ‘we’) by a third-party provider (‘Everest Fortune Group’). Please be reminded that you are solely responsible for the trading decisions on your account. There is a very high degree of risk involved in trading. Any information and/or content is intended entirely for research, educational and informational purposes only and does not constitute investment or consultation advice or investment strategy. The information is not tailored to the investment needs of any specific person and therefore does not involve a consideration of any of the investment objectives, financial situation or needs of any viewer that may receive it. Kindly also note that past performance is not a reliable indicator of future results. Actual results may differ materially from those anticipated in forward-looking or past performance statements. We assume no liability as to the accuracy or completeness of any of the information and/or content provided herein and the Company cannot be held responsible for any omission, mistake nor for any loss or damage including without limitation to any loss of profit which may arise from reliance on any information supplied by Everest Fortune Group.
$SPX Resistance and Downward Momentum Resistance and Downward Momentum at the Top of the Gap, which is also the top of Friday’s Implied move.
I took 5645/5675 0dte bear call spreads, 1/4 width to start and so far so good.
Let’s see if we get the downward pull of todays trading range here.

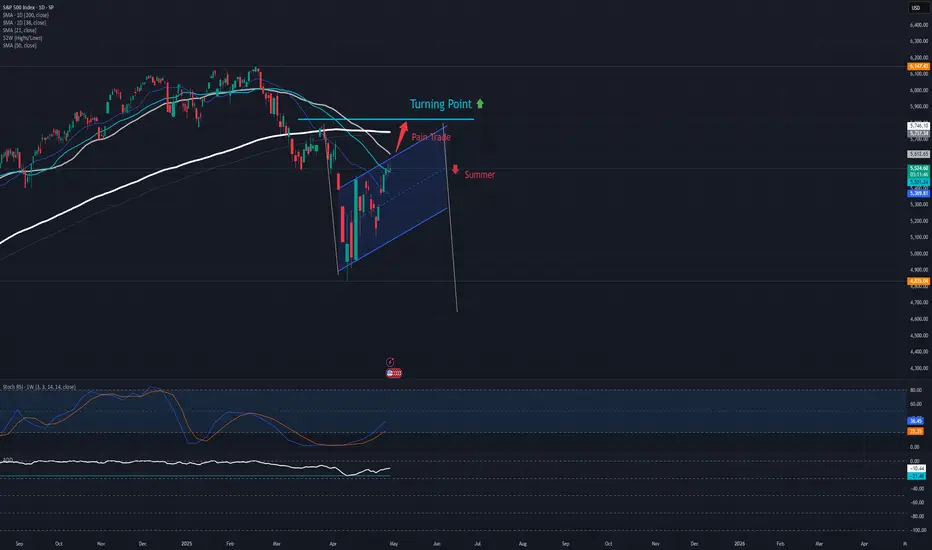
S&P 500 unlikely to return to up trendThe implemented tariff policy of the Trump Administration is expected to hit its fallout on the market by Q3 2025, consequentially the earnings of companies. If the SPX is to have a chance to return to the uptrend this year, it has to confirm two days closings above the turning point before summer.
The inverse effect of tariffs is that it soars with the price: any attempt to adapt on the net price point levers the total price; it's not a fixed number. This leverage applies also to inflation, resulting in consumer sentiment to sour. There is a natural time gap between the implementation of tariffs and the return of industry expected by the Trump Administration - the tariffs have been falling like a chainsaw on international business and supply relations, but rebuilding factories requires time and investment. In this gap the required investments will add pressure to companies' earnings...
These news and outlook brings out funds managers to sell America 'bigly' and to re-evaluate their diversification, bringing down stock prices eventually. The tariff-rebuild-gap is expected to set in by summer, but it is unclear when it would end: so far it is uncertain how much of the industry would return to America to produce and circumvent tariffs. A few big companies announced to build manufactories in the USA, but mostly they plan for only one factory and it still requires building. The Midterm Elections could set the Republican super-majority in both houses to fall and, by extension, have Congress retake the right to set and lift tariffs from the White House. However, it is unclear whether they would use their retaken privilege, as one truth about tariffs, like about all taxes: they're easily introduced, but can take generations to go away again.
All this forms a painstaking 2H scenario for 2025, its rock-bottom too early to call.
Short Pullback Bigger RallySPX Daily Chart
SPX has made two island reversals and gapped up.
There are two resistances near 5500 and 5700. Some short pull backs in this region.
Thereafter, a rally up to the earlier high of 6200.

A pullback is expectedA pullback is expected but a rally into the open first looks probable. If the pullback looks strong, it could be a C wave down with another move to 5700+ after.


SPX Peaks at 6,100; Correction Toward 4,600 LikelyThe SP:SPX ’s rally, which kicked off at 3,500 in late 2022, climaxed around 6,100 in February 2025.
Since then, the trend has clearly reversed, and I expect the correction to persist. As long as the index remains below 5,800 (supply), downward momentum should continue.
A pullback toward 4,600 by 2026 appears plausible, with that level likely acting as resistance or support—warranting a fresh assessment upon arrival.
In the near term, the SPX is likely to trade within a 5,100–5,700 range.

Arshitecture / 30 Min Short Position SP500After the price reaches TP1, hold the current short position and consider adding to it on valid signals to ride the move toward TP2. Apply the same strategy for TP3, scaling in cautiously at key resistance zones.
I’ll share the key confirmations on the chart as they appear.
Goodluck BLUEBERRY:SP500

SPX bullishI am now bullish in near term. For those following me, I have updated HILO EMA squeeze band with an option to plot more lines as seen this chart. I see a swing high of 5770, although a bit cautious about the month end. Market is tired of Trump tantrums and more focused on earnings which have been great so far. For near term month or two I would be looking for bye the dip
