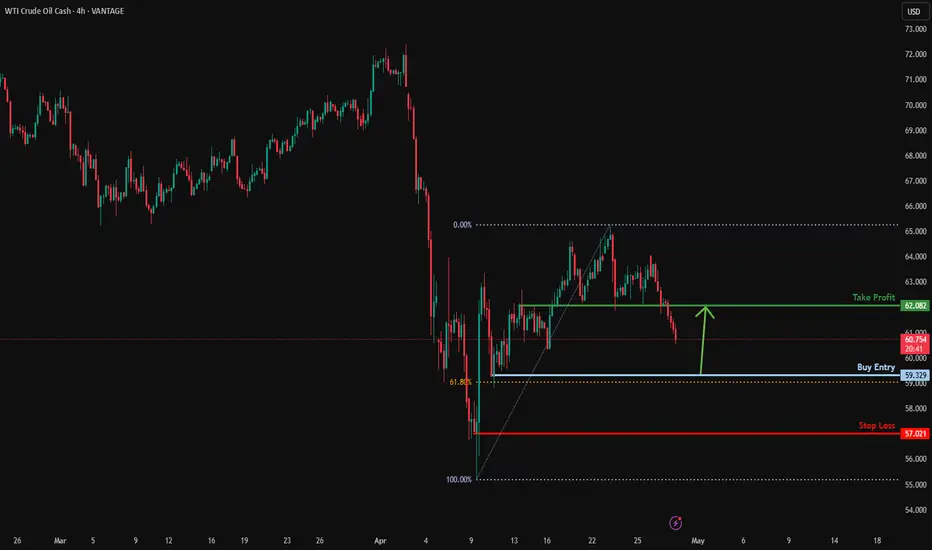
Could the price bounce from here?USO/USD is falling towards the support level which is a pullback support that lines up with the 61.8% Fibonacci retracement and could bounce from this level to our take profit.
Entry: 59.32
Why we like it:
There is a pullback support level that lines up with the 61.8% Fibonacci retracement.
Stop loss: 57.02
Why we like it:
There is a pullback support level.
Take profit: 62.08
Why we like it:
There is an overlap resistance level.
Enjoying your TradingView experience? Review us!
Please be advised that the information presented on TradingView is provided to Vantage (‘Vantage Global Limited’, ‘we’) by a third-party provider (‘Everest Fortune Group’). Please be reminded that you are solely responsible for the trading decisions on your account. There is a very high degree of risk involved in trading. Any information and/or content is intended entirely for research, educational and informational purposes only and does not constitute investment or consultation advice or investment strategy. The information is not tailored to the investment needs of any specific person and therefore does not involve a consideration of any of the investment objectives, financial situation or needs of any viewer that may receive it. Kindly also note that past performance is not a reliable indicator of future results. Actual results may differ materially from those anticipated in forward-looking or past performance statements. We assume no liability as to the accuracy or completeness of any of the information and/or content provided herein and the Company cannot be held responsible for any omission, mistake nor for any loss or damage including without limitation to any loss of profit which may arise from reliance on any information supplied by Everest Fortune Group.
SPOTCRUDE trade ideas
WTI Oil H4 | Pullback resistance at 50% Fibonacci retracementWTI oil (USOIL) is rising towards a pullback resistance and could potentially reverse off this level to drop lower.
Sell entry is at 60.49 which is a pullback resistance that aligns with the 50.0% Fibonacci retracement.
Stop loss is at 62.30 which is a level that sits above the 61.8% Fibonacci retracement and an overlap resistance.
Take profit is at 56.68 which is a multi-swing-low support.
High Risk Investment Warning
Trading Forex/CFDs on margin carries a high level of risk and may not be suitable for all investors. Leverage can work against you.
Stratos Markets Limited (tradu.com):
CFDs are complex instruments and come with a high risk of losing money rapidly due to leverage. 63% of retail investor accounts lose money when trading CFDs with this provider. You should consider whether you understand how CFDs work and whether you can afford to take the high risk of losing your money.
Stratos Europe Ltd (tradu.com):
CFDs are complex instruments and come with a high risk of losing money rapidly due to leverage. 63% of retail investor accounts lose money when trading CFDs with this provider. You should consider whether you understand how CFDs work and whether you can afford to take the high risk of losing your money.
Stratos Global LLC (tradu.com):
Losses can exceed deposits.
Please be advised that the information presented on TradingView is provided to Tradu (‘Company’, ‘we’) by a third-party provider (‘TFA Global Pte Ltd’). Please be reminded that you are solely responsible for the trading decisions on your account. There is a very high degree of risk involved in trading. Any information and/or content is intended entirely for research, educational and informational purposes only and does not constitute investment or consultation advice or investment strategy. The information is not tailored to the investment needs of any specific person and therefore does not involve a consideration of any of the investment objectives, financial situation or needs of any viewer that may receive it. Kindly also note that past performance is not a reliable indicator of future results. Actual results may differ materially from those anticipated in forward-looking or past performance statements. We assume no liability as to the accuracy or completeness of any of the information and/or content provided herein and the Company cannot be held responsible for any omission, mistake nor for any loss or damage including without limitation to any loss of profit which may arise from reliance on any information supplied by TFA Global Pte Ltd.
The speaker(s) is neither an employee, agent nor representative of Tradu and is therefore acting independently. The opinions given are their own, constitute general market commentary, and do not constitute the opinion or advice of Tradu or any form of personal or investment advice. Tradu neither endorses nor guarantees offerings of third-party speakers, nor is Tradu responsible for the content, veracity or opinions of third-party speakers, presenters or participants.

Bearish reversal off pullback resistance?USO/USD is reacting off the resistance level which is a pullback resistance that is slightly below the 50% Fibonacci retracement and could drop from this level to our take profit.
Entry: 60.04
Why we like it:
There is a pullback resistance level that is slightly below the 50% Fibonacci retracement.
Stop loss: 62.00
Why we like it:
There is a pullback resistance level that is slightly below the 71% Fibonacci retracement.
Take profit: 56.89
Why we like it:
There is a pullback support level.
Enjoying your TradingView experience? Review us!
Please be advised that the information presented on TradingView is provided to Vantage (‘Vantage Global Limited’, ‘we’) by a third-party provider (‘Everest Fortune Group’). Please be reminded that you are solely responsible for the trading decisions on your account. There is a very high degree of risk involved in trading. Any information and/or content is intended entirely for research, educational and informational purposes only and does not constitute investment or consultation advice or investment strategy. The information is not tailored to the investment needs of any specific person and therefore does not involve a consideration of any of the investment objectives, financial situation or needs of any viewer that may receive it. Kindly also note that past performance is not a reliable indicator of future results. Actual results may differ materially from those anticipated in forward-looking or past performance statements. We assume no liability as to the accuracy or completeness of any of the information and/or content provided herein and the Company cannot be held responsible for any omission, mistake nor for any loss or damage including without limitation to any loss of profit which may arise from reliance on any information supplied by Everest Fortune Group.

us oil (1w)repeating of structres...
as previous...
its supply is going to over right now... and it may a hard pulll back at this leve...

USOIL:Sharing of the Trading Strategy for Next Week This week’s trading wrapped up successfully. Our exclusive VIP trading signals achieved a 90% accuracy rate!
Currently, the crude oil market is affected by factors such as the economic data of the United States and the expectations of production increases by OPEC+ and is generally showing weakness, with prices fluctuating. Pay attention to the resistance level at 60 above. If the price fails to effectively break through this resistance level, considering taking a short position with a light position can be an option.
Trading Strategy:
sell@60-59
TP:57-55
The signals in the Signature have brought about continuous profits, and accurate signals are shared every day. Hurry up and click to get them!
👇 👇 👇 Obtain signals👉👉👉

USOIL BULLS WILL DOMINATE THE MARKET|LONG
USOIL SIGNAL
Trade Direction: long
Entry Level: 59.70
Target Level: 63.67
Stop Loss: 57.06
RISK PROFILE
Risk level: medium
Suggested risk: 1%
Timeframe: 12h
Disclosure: I am part of Trade Nation's Influencer program and receive a monthly fee for using their TradingView charts in my analysis.
✅LIKE AND COMMENT MY IDEAS✅

WTI rises above $57.50, continues recovery despite concerns overWest Texas Intermediate (WTI) crude Oil price continues to recover during Asian trading on Tuesday, hovering around $57.60 per barrel after a nearly 2% decline on Monday. However, gains were capped by concerns over rising global supply following an OPEC+ decision to accelerate output increases.
Last week, OPEC+, the Organization of the Petroleum Exporting Countries and its allies, agreed to ramp up production for a second straight month, announcing an additional 411,000 barrels per day (bpd) increase for June. This increase, contributed by eight members including Russia, brings the combined rise for April, May, and June to 960,000 bpd—effectively reversing 44% of the 2.2 million bpd in cuts implemented since 2022, according to Reuters estimates.
Sources within the group told Reuters that OPEC+ could fully reverse its voluntary cuts by the end of October if compliance with output quotas does not improve. Saudi Arabia is reportedly pressuring the group to accelerate the rollback of cuts to penalize Iraq and Kazakhstan for their repeated failure to meet agreed production targets.

USOIL – Buyers Might Be Waking UpFrom last week, USOIL dropped aggressively from the 65.27 resistance zone and hit our 57.00 support target — a level we’ve been watching closely.
Now here’s where it gets interesting…
Current Observation:
The 57.00 support seems to be holding strong.
We’re starting to see signs that sellers might be losing momentum around this zone.
Price has reacted with a bounce, and if it sustains above 57.00, we could see the buyers step back in.
What I'm Watching:
– A confirmed hold above 57.00 could offer a buy opportunity, targeting to see a break above 59.5 first, then possibly 61.8 – 62.0.
– However, if 57.00 breaks, I’ll be shifting bias back to the downside, watching 55.10 next.
Key Levels:
– Support: 57.00 → 55.10
– Resistance: 59.5 → 62.0 → 65.27
At this point, it's all about how price reacts around 57.00 and 59.50.
A bounce and strong close above? I’ll be looking to go long.
Failure to hold? The sell pressure might continue.
Let’s see how this plays out. Trade safe.

A Preliminary Double Bottom Support Pattern May Be FormingCurrently, factors such as geopolitics, OPEC+ policies, and the trend of the US dollar all have a two-sided impact on USOIL. Only the technical aspect reveals directional signals.
This week, the crude oil price rebounded rapidly after hitting a low of $56. It has formed the embryonic form of a double bottom with the previous low point, and this pattern may become a turning point in the market trend. According to the theory we proposed earlier, "A deep correction breeds a strong rebound," the price of $56 has become a key support level. If the oil price stabilizes at this level next week, the double bottom pattern is expected to be confirmed, which will in turn trigger a technical rebound. Conversely, once this key level is effectively broken, it is likely to trigger a concentrated sell-off of stop-loss orders, intensifying the downward pressure on the price.
I am committed to sharing trading signals every day. Among them, real-time signals will be flexibly pushed according to market dynamics. All the signals sent out last week accurately matched the market trends, helping numerous traders achieve substantial profits. Regardless of your previous investment performance, I believe that with the support of my professional strategies and timely signals, I will surely be able to assist you in breaking through investment bottlenecks and achieving new breakthroughs in the trading field.


Double bottom pattern for USOILFirst tp 70$
Second tp 80$
Oil in it ways make a beautiful pattern
I see DB pattern
For target you see two hidden gap

WTIThis is WTI, and if we look at previous analyses, I predicted that when the price reached the first zone, it would rise to the major upper zone. The price then dropped and broke through Zone 1.
This time, although the price has breached the first zone, it doesn’t mean it won’t reach the upper zone. So, I now predict the price will make a very strong upward move and break through the first zone again and hit the take profit (TP).

USOIL Is Going Up! Buy!
Please, check our technical outlook for USOIL.
Time Frame: 9h
Current Trend: Bullish
Sentiment: Oversold (based on 7-period RSI)
Forecast: Bullish
The price is testing a key support 57.535.
Current market trend & oversold RSI makes me think that buyers will push the price. I will anticipate a bullish movement at least to 61.620 level.
P.S
The term oversold refers to a condition where an asset has traded lower in price and has the potential for a price bounce.
Overbought refers to market scenarios where the instrument is traded considerably higher than its fair value. Overvaluation is caused by market sentiments when there is positive news.
Disclosure: I am part of Trade Nation's Influencer program and receive a monthly fee for using their TradingView charts in my analysis.
Like and subscribe and comment my ideas if you enjoy them!

WTI Oil H4 | Rising into a swing-high resistanceWTI oil (USOIL) is rising towards a swing-high resistance and could potentially reverse off this level to drop lower.
Sell entry is at 59.71 which is a swing-high resistance that aligns close to the 50.0% Fibonacci retracement.
Stop loss is at 62.30 which is a level that sits above an overlap resistance.
Take profit is at 55.10 which is a swing-low support.
High Risk Investment Warning
Trading Forex/CFDs on margin carries a high level of risk and may not be suitable for all investors. Leverage can work against you.
Stratos Markets Limited (tradu.com):
CFDs are complex instruments and come with a high risk of losing money rapidly due to leverage. 63% of retail investor accounts lose money when trading CFDs with this provider. You should consider whether you understand how CFDs work and whether you can afford to take the high risk of losing your money.
Stratos Europe Ltd (tradu.com):
CFDs are complex instruments and come with a high risk of losing money rapidly due to leverage. 63% of retail investor accounts lose money when trading CFDs with this provider. You should consider whether you understand how CFDs work and whether you can afford to take the high risk of losing your money.
Stratos Global LLC (tradu.com):
Losses can exceed deposits.
Please be advised that the information presented on TradingView is provided to Tradu (‘Company’, ‘we’) by a third-party provider (‘TFA Global Pte Ltd’). Please be reminded that you are solely responsible for the trading decisions on your account. There is a very high degree of risk involved in trading. Any information and/or content is intended entirely for research, educational and informational purposes only and does not constitute investment or consultation advice or investment strategy. The information is not tailored to the investment needs of any specific person and therefore does not involve a consideration of any of the investment objectives, financial situation or needs of any viewer that may receive it. Kindly also note that past performance is not a reliable indicator of future results. Actual results may differ materially from those anticipated in forward-looking or past performance statements. We assume no liability as to the accuracy or completeness of any of the information and/or content provided herein and the Company cannot be held responsible for any omission, mistake nor for any loss or damage including without limitation to any loss of profit which may arise from reliance on any information supplied by TFA Global Pte Ltd.
The speaker(s) is neither an employee, agent nor representative of Tradu and is therefore acting independently. The opinions given are their own, constitute general market commentary, and do not constitute the opinion or advice of Tradu or any form of personal or investment advice. Tradu neither endorses nor guarantees offerings of third-party speakers, nor is Tradu responsible for the content, veracity or opinions of third-party speakers, presenters or participants.

Bullish breakout?WTI Oil (XTI/USD) is reacting off the pivot which is a pullback resistance and could potentially rise to the 1st resistance.
Pivot: 59.28
1st Support: 57.84
1st Resistance: 61.83
Risk Warning:
Trading Forex and CFDs carries a high level of risk to your capital and you should only trade with money you can afford to lose. Trading Forex and CFDs may not be suitable for all investors, so please ensure that you fully understand the risks involved and seek independent advice if necessary.
Disclaimer:
The above opinions given constitute general market commentary, and do not constitute the opinion or advice of IC Markets or any form of personal or investment advice.
Any opinions, news, research, analyses, prices, other information, or links to third-party sites contained on this website are provided on an "as-is" basis, are intended only to be informative, is not an advice nor a recommendation, nor research, or a record of our trading prices, or an offer of, or solicitation for a transaction in any financial instrument and thus should not be treated as such. The information provided does not involve any specific investment objectives, financial situation and needs of any specific person who may receive it. Please be aware, that past performance is not a reliable indicator of future performance and/or results. Past Performance or Forward-looking scenarios based upon the reasonable beliefs of the third-party provider are not a guarantee of future performance. Actual results may differ materially from those anticipated in forward-looking or past performance statements. IC Markets makes no representation or warranty and assumes no liability as to the accuracy or completeness of the information provided, nor any loss arising from any investment based on a recommendation, forecast or any information supplied by any third-party.

OilusdEASYMARKETS:OILUSD
This wave analysis is one of many possible scenarios and is not a recommendation to buy or sell

WTI TRADE UPDATEhi all
Based on the current situation for WTI, with the stop loss hit from the previous trade idea, Plan A now relies on a breakout of the trendline and the support turning into resistance as confirmation for taking a long position.
However, if rejection occurs at the trendline or at the support-turned-resistance level, there's a possibility that the price will decline again, given that a breakout has already happened on the daily timeframe. Therefore, closely monitoring price movements around these key levels is crucial before making any trading decisions.
Ensure strong confirmation before acting, and keep an eye on shifts in market structure. Feel free to share any new updates, and best of luck with your strategy!
good luck all
**My trading strategy is not intended to be a signal. It's a process of learning about market structure and sharpening my trading my skills also for my trade journal**
Thanks a lot for your support

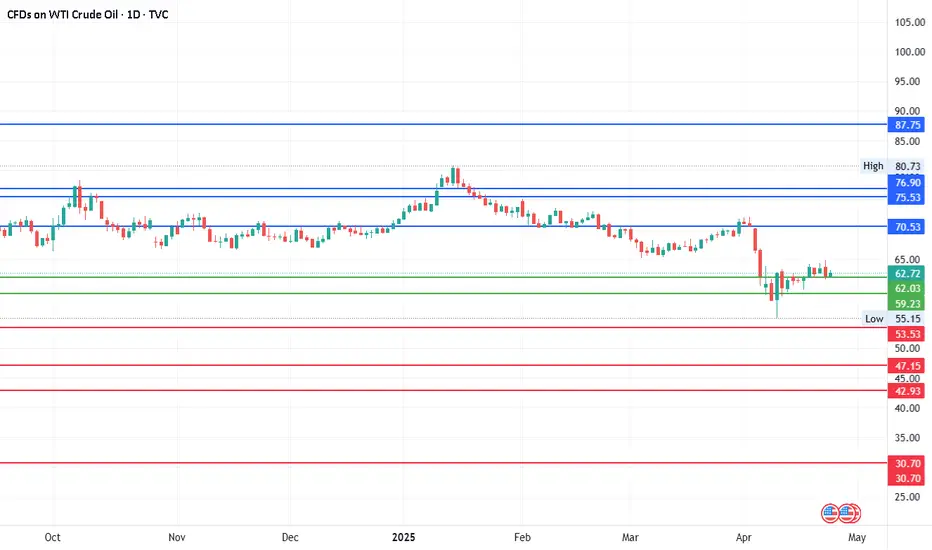
Crude oilCurrent Price: 62.60
Mid-Point Range: 59.23 to 62.03
Upside Targets: 70.53, 75.53, 76.90 and 87.75 (Between 75.53 & 76.90 could be next
Posible range to be in a consolidation mode.
Downside Targets: 53.53, 47.15, 42.93, 30.70
Can it hit the bottom and rebound?Fundamental Analysis: Driven by the trade concerns sparked by Trump and the risk aversion sentiment arising from the global economic slowdown, the trajectory of oil prices has been shaped. Additionally, OPEC+ convened an early meeting on Saturday and confirmed an increase in production of 411,000 barrels per day in June. This decision has indubitably intensified the market's apprehensions regarding the oversupply of crude oil 📉.
Technical Analysis: Technically speaking, the price of crude oil has persistently lingered below the midline of the Bollinger Bands, distinctly indicating that the bearish trend is in the ascendancy 📉. Last week, on the weekly chart, it closed with a substantial bearish candlestick, exhibiting a downward tail pattern, and in the short term, the price has been fluctuating within a trading range 📊. As for the upcoming week's trend, whether the support level established by the previous double doji bottoming formation will be broken through effectively will be the focal point of market attention 👀. Nevertheless, once the price reaches the crucial support level, there exists the potential for a technical rebound. Investors should closely monitor the variations in trading volume and the response of the moving average system 📈.
Market Situation: It is crucial to note that due to the holiday factor in the Asian market next Monday, market liquidity is anticipated to decline significantly. Under such circumstances, the oil price is likely to encounter a higher risk of more pronounced volatility, further escalating the uncertainty of the market situation ⚠️.
⚡⚡⚡ USOIL ⚡⚡⚡
🚀 Buy@56.0 - 57.0
🚀 TP 59.0 - 60.0
Accurate signals are updated every day 📈 If you encounter any problems during trading, these signals can serve as your reliable guide 🧭 Feel free to refer to them! I sincerely hope they'll be of great help to you 🌟

OIL TRADE IDAHello
Hi everyone. Regarding oil movements, I see a long opportunity at the level of 59.61. If the price closes below 58.56, there is a possibility of a temporary rise before continuing to drop to 55.
good luck all
**My trading strategy is not intended to be a signal. It's a process of learning about market structure and sharpening my trading my skills also for my trade journal**
Thanks a lot for your support

WTI Oil H4 | Swing-high resistance at 50% Fibonacci retracementWTI oil (USOIL) is rising towards a swing-high resistance and could potentially reverse off this level to drop lower.
Sell entry is at 59.68 which is a swing-high resistance that aligns close to the 50.0% Fibonacci retracement.
Stop loss is at 62.30 which is a level that sits above an overlap resistance.
Take profit is at 56.05 which is a multi-swing-low support.
High Risk Investment Warning
Trading Forex/CFDs on margin carries a high level of risk and may not be suitable for all investors. Leverage can work against you.
Stratos Markets Limited (tradu.com):
CFDs are complex instruments and come with a high risk of losing money rapidly due to leverage. 63% of retail investor accounts lose money when trading CFDs with this provider. You should consider whether you understand how CFDs work and whether you can afford to take the high risk of losing your money.
Stratos Europe Ltd (tradu.com):
CFDs are complex instruments and come with a high risk of losing money rapidly due to leverage. 63% of retail investor accounts lose money when trading CFDs with this provider. You should consider whether you understand how CFDs work and whether you can afford to take the high risk of losing your money.
Stratos Global LLC (tradu.com):
Losses can exceed deposits.
Please be advised that the information presented on TradingView is provided to Tradu (‘Company’, ‘we’) by a third-party provider (‘TFA Global Pte Ltd’). Please be reminded that you are solely responsible for the trading decisions on your account. There is a very high degree of risk involved in trading. Any information and/or content is intended entirely for research, educational and informational purposes only and does not constitute investment or consultation advice or investment strategy. The information is not tailored to the investment needs of any specific person and therefore does not involve a consideration of any of the investment objectives, financial situation or needs of any viewer that may receive it. Kindly also note that past performance is not a reliable indicator of future results. Actual results may differ materially from those anticipated in forward-looking or past performance statements. We assume no liability as to the accuracy or completeness of any of the information and/or content provided herein and the Company cannot be held responsible for any omission, mistake nor for any loss or damage including without limitation to any loss of profit which may arise from reliance on any information supplied by TFA Global Pte Ltd.
The speaker(s) is neither an employee, agent nor representative of Tradu and is therefore acting independently. The opinions given are their own, constitute general market commentary, and do not constitute the opinion or advice of Tradu or any form of personal or investment advice. Tradu neither endorses nor guarantees offerings of third-party speakers, nor is Tradu responsible for the content, veracity or opinions of third-party speakers, presenters or participants.

Oil Drop Short Position
Greetings Traders this is my idea on Oil and it is a Long shot for a Short.
This is my explanation:
On the 4H chart of WTI crude oil, we can observe a well-defined downtrend that began near the $72.50 level. After a sharp sell-off, price entered a brief accumulation phase and has now pulled back into a previous support zone — now acting as resistance — offering a prime opportunity for trend continuation.
🔑 Key Technical Zones:
🟥 Beginning of a Downtrend: Around $72.50 – local top and start of bearish momentum.
🟧 Breakdown Zone: Around $59.00 – key support turned resistance after a strong breakdown.
🟦 Accumulation Zone: Around $62.00–64.00 – consolidation phase before continuing lower.
✅ Retracement Area (Green Box): Around $60.00–60.25 – previous support now acting as resistance; ideal zone to re-enter short.
🔵 Target Zone: $53.30 – projected next support level and target for the short position.
🎯 Active Short Position:
Entry: $60.00
Stop Loss: $61.20 (above retracement zone)
Take Profit: $53.30
Risk/Reward Ratio: ~1:4.5
After a confirmed bearish structure, price pulled back into the retracement area, which previously acted as support. This area is now likely to serve as resistance, and price rejection here aligns with a high-probability trend continuation trade.
The target for the short is set at $53.30, which corresponds with the previous swing low, while the stop loss is positioned safely above the rejection zone to avoid false breakouts.
📈 Conclusion:
This setup reflects a textbook lower high formation within a strong downtrend, offering a clean structure and favorable risk-to-reward ratio. Watching closely for bearish confirmations within the retracement zone to validate momentum continuation.
Dear Traders like,comment let me know what do you think?

Market Analysis and Trading Strategy of USOILThe USOIL market has witnessed significant fluctuations recently. Yesterday, the price broke below the key support level of $61.5, and then it has been declining all the way. As of today, it has approached the vicinity of $59.5. This downward trend reflects that the bearish force currently dominates the market.
From a technical analysis perspective, once the support level of $61.5 is broken, its nature will transform into a strong resistance level. The rapid decline of the price to $59.5 indicates strong bearish momentum. Currently, the focus of the market is on the $59 mark, which is of crucial importance. If this support level is breached, according to the continuity of the price trend and the technical pattern, USOIL is highly likely to continue to decline further. The next important support level is around $57.5. Conversely, if the price can be effectively supported near $59, based on the technical repair demand after being oversold, the price is expected to rebound.
Based on the above analysis, in terms of trading strategy, investors can consider taking a short position near $60. If the price breaks below $59, the short position can be held, with the target price set at $57.5. If the price stabilizes and rebounds near $59, the stop-loss order should be executed in a timely manner to avoid expanding losses. Given the frequent release of important data recently and the significant impact of these data, market volatility will increase significantly. Investors must trade with caution, strictly control their positions, and set reasonable stop-loss levels to cope with the possible sharp price fluctuations.
I am committed to sharing trading signals every day. Among them, real-time signals will be flexibly pushed according to market dynamics. All the signals sent out last week accurately matched the market trends, helping numerous traders achieve substantial profits. Regardless of your previous investment performance, I believe that with the support of my professional strategies and timely signals, I will surely be able to assist you in breaking through investment bottlenecks and achieving new breakthroughs in the trading field.
