Shorting XTIUSD Took me 2 years to actually understand trend is your friend and Fib don't lie
Clear short
SPOTCRUDE trade ideas

USOIL trading alerts. Pressure and support.Oil also fell according to instructions. I just forgot to remind you. Sorry, but the profit is quite good. Sell short from 58.7. Then the lowest reached 56.34
But today in the New York market, USOIL rose again above 58. From a fundamental perspective. The market will continue to fall under pressure. But from the trend, we need to pay attention to the support of 58. If it does not fall today, it is likely to continue to fall based on Friday's trend. The pressure level near 59 needs to be paid attention to. In terms of operation, it is still mainly selling at high levels.
Always remind trading risks. So don't ignore this. If you don't know how to trade. Remember to wait and see. Don't trade blindly or gamble.
Many investor friends know that I have led some investors to create good profits for several consecutive days. If you don't know how to trade, remember to leave me a message and try it. Maybe your profit will double.

USOIL... 1D CHART PATTERNHere's my USOIL (WTI Crude) trade setup.
- *Trade Type:* Sell
- *Entry Price:* 57.74
- *Stop Loss (SL):* 65.54
- *Take Profit (TP):* 51.40
*Quick Risk/Reward Analysis:*
- *Risk:* 65.54 - 57.74 = *7.80*
- *Reward:* 57.74 - 51.40 = *6.34*
- *Risk/Reward Ratio:* 6.34 / 7.80 ≈ *0.81*
*Comment:*
This setup has a risk greater than the potential reward, which is not ideal. A better trade usually has a risk/reward ratio of at least 1:1, preferably 1:2 or more. You might consider adjusting your TP or SL, or confirming the direction with technical/fundamental analysis.

WTI Wave Analysis – 29 April 2025
- WTI reversed from the resistance area
- Likely to fall to support level 58.00
WTI crude oil recently reversed from the resistance area between the resistance level 64.60 (former multi-month low from September 2024), the 20-day moving average and the 61.8% Fibonacci correction of the downward impulse from the start of April.
The downward reversal from this resistance started the active short-term impulse wave 5, which belongs to the intermediate impulse sequence from last year.
Given the clear daily uptrend, WTI crude oil can be expected to fall toward the next support level 58.00.

USOIL: Recent Analysis and Trading StrategiesOver the past two weeks, USOIL has been continuously fluctuating and consolidating within the price range of $61.5 - $64.5. The overall trend shows a pattern of rising first and then falling. During the upward phase, the bullish momentum was scarce, making it difficult to achieve an effective breakthrough. Subsequently, it shifted into a downward trend. Yesterday's market situation was particularly typical. It opened higher at $63.5 in the early trading session and then declined all the way. It not only broke below the key support level of $61.5 but also had weak rebound strength. Currently, the price is still hovering around this support level, indicating the market's indecision.
Currently, most investment institutions hold a pessimistic view on the future of USOIL. However, it is worth noting that the price has touched the support level of $61.5 five times in the past two weeks. Although it briefly broke below this level twice, it failed to effectively form a trending breakthrough. The principle that "if a support level can't be broken after repeated attempts, there will be a rebound" has been verified many times in similar situations, suggesting that there may be strong potential buying power at this support level.
Based on the above analysis, today's trading strategy is recommended to maintain a cautiously bearish tone, but it is necessary to closely guard against potential technical rebound risks. During the trading process, it is essential to set stop-loss levels strictly to avoid the expansion of losses due to sudden market movements. At the same time, it is advisable to reduce aggressive trading and mainly adopt a wait-and-see approach. Be patient and wait for clearer trend signals, and then choose the right time to enter the market when the market direction becomes more explicit.
USOIL
sell@62-62.5
tp:61-60.5
sl:62.8
In the future, we will continue to monitor the market changes and update the trading strategies in real time.
I am committed to sharing trading signals every day. Among them, real-time signals will be flexibly pushed according to market dynamics. All the signals sent out last week accurately matched the market trends, helping numerous traders achieve substantial profits. Regardless of your previous investment performance, I believe that with the support of my professional strategies and timely signals, I will surely be able to assist you in breaking through investment bottlenecks and achieving new breakthroughs in the trading field.


The price fluctuation range of USOIL is quite obvious.In the past two weeks, USOIL has been continuously fluctuating within the price range of $61.5 - $64.5. Its trend shows a pattern of rising first and then falling. During the upward phase, there was a slight lack of momentum, and subsequently, it entered a downward channel. This kind of fluctuation is not isolated but has complex underlying causes.
In terms of trading strategies, given that the current price fluctuation range is relatively clear, a strategy of selling high and buying low within the range of $61.5 - $64.5 can be considered. However, it should be noted that once the price breaks through the above-mentioned range, the strategy should be adjusted in a timely manner to follow the market trend, and one should be on guard against the risks brought about by a one-sided market.
USOIL
sell:63.5-64
tp:62.5-62
I am committed to sharing trading signals every day. Among them, real-time signals will be flexibly pushed according to market dynamics. All the signals sent out last week accurately matched the market trends, helping numerous traders achieve substantial profits. Regardless of your previous investment performance, I believe that with the support of my professional strategies and timely signals, I will surely be able to assist you in breaking through investment bottlenecks and achieving new breakthroughs in the trading field.

USOIL-crude about to resume lower?WTI formed a large bearish engulfing candle on its daily chart yesterday near the key $65 resistance level. Was that an indication that prices have ended their corrective bounce? Time will tell, but today's oil prices have bounced back. With the trade uncertainty in the background, demand concerns remain high.
So, I wouldn't be surprised if prices were to resume lower from here. The trend is clearly bearish with the moving averages all pointing lower, not to mention the lower highs and lower lows.
If the selling resumes, watch for possible bounces at the next key round handles like $62, $61 and $60. But there is always the possibility of a sweep below this month's earlier lows if macro concerns intensify.
Meanwhile, the bullish idea is off the table for me for now until we see some progress in US-China trade talks at least, or if prices show a major bullish reversal signal.

USIOL: Trading Strategy for Next WeekAfter reaching the key resistance level, USOIL started to decline. In the trading next week, when it reaches the vicinity of the resistance level of $64.5, you can continue to go short.
All the signals I sent have been profitable, and I will continue to send accurate signals.
USOIL Trading Strategy:
usoil sell@64.5-65
tp:63-61

USOIL: Bears Are Winning! Short!
My dear friends,
Today we will analyse USOIL together☺️
The market is at an inflection zone and price has now reached an area around 63.133 where previous reversals or breakouts have occurred.And a price reaction that we are seeing on multiple timeframes here could signal the next move down so we can enter on confirmation, and target the next key level of 62.366..Stop-loss is recommended beyond the inflection zone.
❤️Sending you lots of Love and Hugs❤️

SHORT OIL Break of support and retest**Oil Sell Setup:**
1. **Entry:**
- Sell at rejection of 0.50 daily Fib + 20 MA confluence
- Wait for bearish confirmation candle
2. **Stop Loss:**
- Place above recent swing high
3. **Take Profit:**
- Target 1: Recent swing low
- Target 2: Previous major swing low
- Target 3: Major support level from higher timeframe
4. **Confirmations:
- Rejection candles at confluence zone
- Failed attempts to close above 20 MA
5. **Management:**
- Scale out at targets
- Move stop to breakeven at first target

Primary and secondary rhythm: sudden drop in crude oil pricesLast week, OPEC announced a new compensation plan to offset previous overproduction. Under the plan, eight affected countries plan to reduce production by a total of 457,000 barrels per day by mid-2026, failing to sustain a short-term rise in oil prices.
Crude oil's short-term trend hit strong resistance near 64.90 and fell, with the decline erasing the gains of the previous three trading days. The MACD fast and slow lines remain within bearish momentum, indicating abundant downward momentum. From the perspective of primary and secondary rhythms, the decline in the North American market yesterday formed a primary downward trend, while the weak rebound in early trading today represents a secondary rhythm. According to the law of primary-secondary alternation, crude oil is expected to continue to decline today, breaking below the 61.50 support level and testing 60.
USOIL
sell@62.8-63.3
tp:61.5-61
I hope this strategy will be helpful to you.
When you find yourself in a difficult situation and at a loss in trading, don't face it alone. Please get in touch with me. I'm always ready to fight side by side with you, avoid risks, and embark on a new journey towards stable profits.

OIL...SHORT BLACKBULL:WTI
is approaching the key resistance zone at .
I'm watching closely for a valid reaction before considering any position.
***If the level breaks and price retests it successfully, I may consider a counter-directional setup.

Long trade
30min TF overview
🛢 WTICOUSD – Buy-Side Trade
📅 Date: Thursday, 24th April 2025
🕘 Time: 9:00 AM (New York Time)
📍 Session: London AM
📊 Entry Timeframe: (5m)
Trade Parameters
Entry Price: 63.238
Take Profit: 66.619 (+5.54%)
Stop Loss: 63.036 (–0.32%)
Risk-Reward Ratio (RR): 16.74
Reasoning - Narrative
This WTI Crude Oil long trade was initiated during the London AM session, a time when commodity markets often see increased activity and institutional positioning. The trade followed a sharp reaction off a discounted price zone, which aligned with a previously unmitigated bullish order block on the intraday chart.
Before entry, price performed a liquidity sweep below 63.10, triggering stops from earlier long positions and clearing out sell-side pressure

USOILThis chart for WTI Crude Oil presents a bullish continuation setup following a rebound from the support level around 61.50. After breaking above a minor consolidation range, price is now retracing slightly before potentially continuing its upward movement.
The chart highlights a target at63.95, just below the upper resistance zone, which previously acted as a strong supply area.
Technical Breakdown:
- Support Level: Firm bounce near 61.50, confirming demand.
- Minor Breakout: Price broke above local structure and retesting for continuation.
- Resistance Zone: Located near64.00, target aligns with historical supply.
- Next Target: 63.95
Volume spikes during the bounce suggest strong buyer interest. A clean break and hold above 63.00 could open the path toward the $63.95 target. Traders may look for bullish price action confirmation for entry.

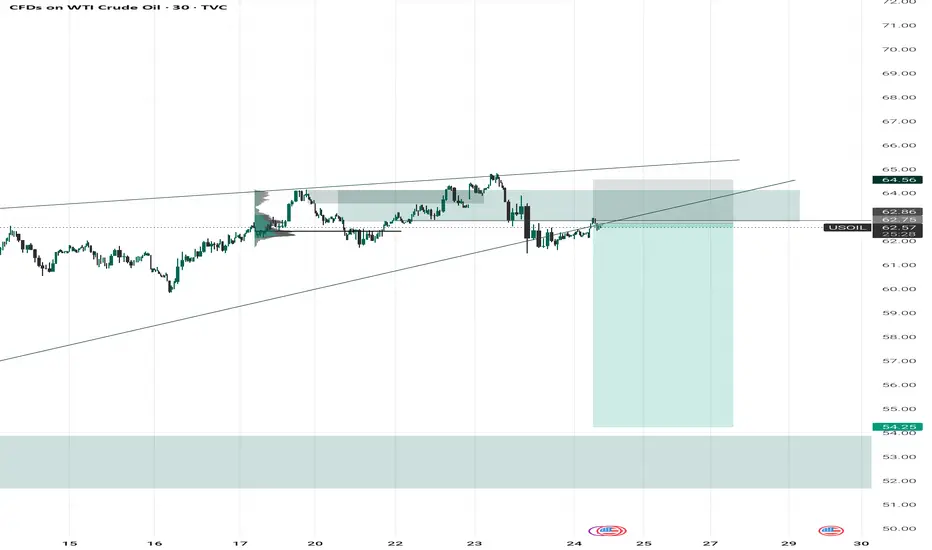
USOIL – Wedge Whisper Turned Rejection Roar
Crude just whispered its next move — and it’s not looking bullish.
After a clean rising wedge breakdown, price is now retesting the underside of the structure, right inside a high-volume supply zone (62.75 - 64.50). This zone screams rejection, especially with that wick-heavy rejection candle teasing a deeper move.
This setup aligns with classic market psychology — buyers trapped at the top, smart money looking for that short squeeze to the downside.
Short Bias Activated
Sell Zone: 62.75 - 64.50
Target: 54.25
Invalidation: Break and close above 64.60
If this plays out, it’s a straight-up slide to the next major demand zone. Eyes on volume and rejection confirmations!
Crude sell trade Crude oil can be sold when price reaches supply zone . Sl above the zone target demand zone . Small sl call

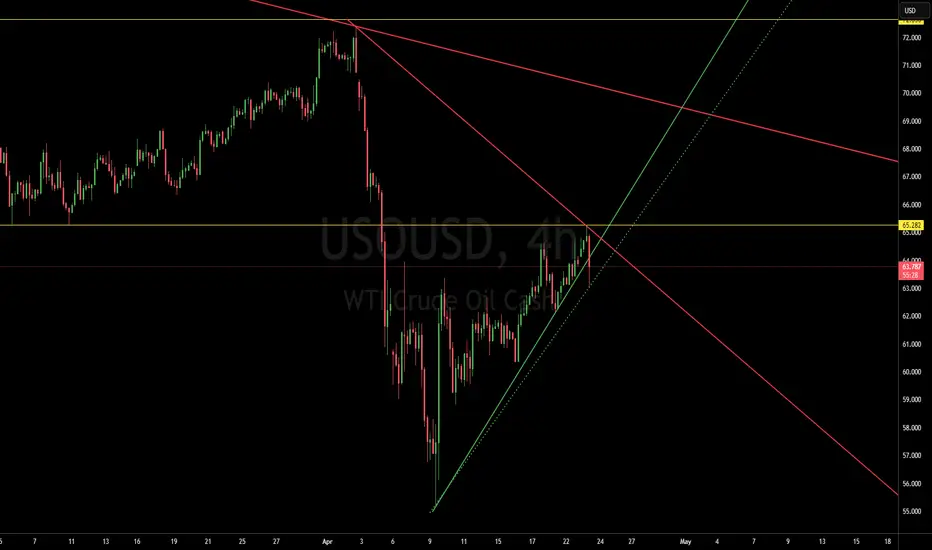
Crude Oil Hits a Ceiling — Will This Confluence Break or Bounce?Price tapped the 65.2 resistance zone (yellow line) and immediately pulled back — showing some hesitation around that confluence of resistance (horizontal + trendline).
This zone has acted as a ceiling before, and now it's back in play.
What I’m Seeing:
- Clean rejection from 65.2
- A clear rising trendline still holding below
- Bearish wicks showing early signs of hesitation
- Confluence of red and green trendlines (compression forming?)
Trade Plan (Not Financial Advice):
I’m personally watching for either:
✅ A strong break above the confluence for possible long entries
❌ Or a rejection followed by confirmation for a short setup
The breakout could be clean — or it could trap bulls/lure bears… staying patient.
Levels in Play:
- Resistance: 65.2
- Support: 63.5
Possible breakdown below the green TL could shift the short-term bias
No setup, no trade.
My edge is in waiting — not chasing.
Cheers!
pClem Trades
WTI Crude Oil oversold bounce back resistance at 6600WTI Crude Oil is showing bearish sentiment, in line with the current downtrend. Recent price action appears to be an oversold bounce back. A break below a key consolidation zone, could add pressure to the downside.
Key Levels:
Resistance: 6600 (former support, now resistance), 6670, 6750
Support: 6323, 6165, 6045
Bearish Outlook:
Price has broken below 6600, which was a key intraday consolidation level. If WTI sees a short-term bounce but fails to break above 6600, it could resume its downward move toward 6323, then 6165, and possibly 6045 over time.
Bullish Scenario:
If WTI breaks above 6600 and closes above it on the daily chart, the bearish setup would be invalidated. This could open the door for a short squeeze rally toward 6670, then 6760.
Conclusion:
The trend remains bearish below 6600. A rejection at this level would reinforce the downside bias. However, a confirmed break and daily close above 6600 would shift the outlook to bullish in the short term.
This communication is for informational purposes only and should not be viewed as any form of recommendation as to a particular course of action or as investment advice. It is not intended as an offer or solicitation for the purchase or sale of any financial instrument or as an official confirmation of any transaction. Opinions, estimates and assumptions expressed herein are made as of the date of this communication and are subject to change without notice. This communication has been prepared based upon information, including market prices, data and other information, believed to be reliable; however, Trade Nation does not warrant its completeness or accuracy. All market prices and market data contained in or attached to this communication are indicative and subject to change without notice.

Crude Oil Tests Critical Support Level at $65.10FenzoFx—Crude Oil is consolidating below the $65.10 resistance, trading around $64.30. The price remains above the 50-period SMA on the 4-hour chart, confirming a bullish trend. However, the Stochastic Oscillator crossing above 20 signals overbought conditions, suggesting a potential pullback.
If oil stays below $65.10, a bearish wave could follow, targeting $62.31 and then $61.75.
Bullish Scenario: A close and stabilization above $65.10 could trigger the uptrend, targeting $67.60.
>>> No Deposit Bonus
>>> %100 Deposit Bonus
>>> Forex Analysis Contest
All at FenzoFx Decentralized Forex Broker

BUY CRUDE OIlBrent Crude looking good at these levels and giving a good price action for a potential upside of 3% from here.

OIL buy setup H1Hello! Friends,
Greetings. Please leave a Like if you like the idea.
Before start talking about technical Let's share your LOVE by giving me LIKES to support this work. Thanks in advance.
