Trade Idea: US30 Short (SELL STOP)1. Technical Analysis
Daily Chart
• Trend: Still overall bullish long-term, but in a short-term pullback phase after peaking.
• MACD: Bearish crossover with widening histogram — indicating continued downside momentum.
• RSI: At 45.05 — neutral-bearish, room to fall to oversold.
• Price: Strong reaction at ~37675.05 area, bounced back to ~39562, forming a potential lower high.
15-Min Chart
• MACD: Recently crossed bearish after a sharp rally.
• Price Action: Approaching resistance zone (~39562), failed to make a new high.
• RSI: 44.78 — leaning bearish, but not oversold yet.
3-Min Chart
• MACD: Just flipped bullish but weak — suggesting possible micro pullback before continuation.
• RSI: 48.82 — very neutral, no extreme condition.
⸻
2. Fundamental Context (as of April 2025)
• Recent sharp pullback from all-time highs hints at risk-off sentiment returning.
• Likely driven by Fed rate uncertainty, inflationary stickiness, or geopolitical jitters.
• Earnings season volatility could also play a role.
• No strong bullish macro catalyst to support a fresh rally continuation yet.
⸻
3. Trade Setup: SHORT Position
Bias: SHORT
Reason: Price hit resistance at 39562, confirmed by 15M MACD cross and RSI weakness. Daily still bearish momentum. No major bullish catalyst.
⸻
ENTRY:
39550 (near current resistance, confirmed failure to break higher)
STOP LOSS (SL):
39800 (above recent minor high, above 15M key level)
TAKE PROFIT (TP):
38900 — Minor support zone, clean level from 15M + previous consolidation area
FUSIONMARKETS:US30
DJI trade ideas

Trade Idea: US30 Long ( BUY LIMIT )Technical Analysis Summary:
Daily Chart:
• The US30 is bouncing off a recent sharp correction with a bullish engulfing candle forming at support (around 37,675).
• RSI is recovering from oversold territory, now at 46.14 – momentum is shifting.
• MACD still bearish but histogram is shrinking, indicating weakening downward momentum.
15-Minute Chart:
• Strong recovery after a double-bottom near 38,200.
• RSI at 74.55 shows near overbought but still trending up – strong momentum.
• MACD showing a strong bullish crossover and rising histogram – confirmation of intraday trend.
3-Minute Chart:
• Strong breakout to the upside with consolidation at highs.
• RSI around 58 – room to move higher.
• MACD bullish, histogram expanding – short-term continuation likely.
⸻
Fundamental Context (as of April 2025):
• Recent correction in US indices is likely a pullback within a broader bull market (based on Q1 earnings optimism and easing inflation expectations).
• No major Fed tightening signals – bullish for equities.
• Dow Jones (US30) often rebounds strongly after panic drops, especially when technicals align with macro calm.
⸻
Trade Setup (Buy):
• Entry: 39,700 (current consolidation after breakout)
• Stop Loss (SL): 39,150 (below last minor pullback structure and below 3M EMA support)
• Take Profit (TP): 40,800 (near previous structure on the Daily and round number psychological level) FUSIONMARKETS:US30

US30: Local Bearish Bias! Short!
My dear friends,
Today we will analyse US30 together☺️
The price is near a wide key level
and the pair is approaching a significant decision level of 39,946.6 Therefore, a strong bearish reaction here could determine the next move down.We will watch for a confirmation candle, and then target the next key level of 39,429.8..Recommend Stop-loss is beyond the current level.
❤️Sending you lots of Love and Hugs❤️

Dow Jones INTRADAY oversold bouncebackKey Support and Resistance Levels
Resistance Level 1: 40954
Resistance Level 2: 41510
Resistance Level 3: 42216
Support Level 1: 39600
Support Level 2: 38534
Support Level 3: 37832
This communication is for informational purposes only and should not be viewed as any form of recommendation as to a particular course of action or as investment advice. It is not intended as an offer or solicitation for the purchase or sale of any financial instrument or as an official confirmation of any transaction. Opinions, estimates and assumptions expressed herein are made as of the date of this communication and are subject to change without notice. This communication has been prepared based upon information, including market prices, data and other information, believed to be reliable; however, Trade Nation does not warrant its completeness or accuracy. All market prices and market data contained in or attached to this communication are indicative and subject to change without notice.

US30Anyone Bearish or Bullish, say something
I willl be aggressively Bullish if US30 breaks the 40000.00 key level and get a clear retest, supporting it to go higher, to 42020.00 key level.
>US30 failed to break 37864.46 key level to continue selling, now 37864.46 is supporting US30 to go higher.
>US30 is supported by the trend line.
But if US30 fails to break the 40000.00 key level. I will be going with the market structure, as US30 is been selling. But will be aggressive selling if US30 trade below 37864.46 key level
Update will be given

US30 Bouncing Back – 23/04/2025🚀 US30 Bouncing Back – 23/04/2025 🚀
📈 Dow Showing Strength Off the Lows!
After bottoming near 38,400, US30 surged back above the key 38,955 level and is now consolidating just below 40k. Short-term trend has flipped bullish 📊.
🔍 Key Observations:
✅ Higher low confirmed
📈 Strong bullish impulse off 38,400
🔄 Retesting EMA support as price consolidates
📍 Still under major resistance at 40,701
🎯 Trade Plan:
🔹 Bullish bias above 38,955
🚀 Long setups valid on break & close above 40,000 → target 40,701 / 41,200
❌ Rejection from here could form a lower high → watch for bearish divergence
🧠 Psych Note: Don't chase this late rally — wait for confirmation above resistance or a pullback for re-entry.

Index US30 may form a long-term SELL trendBased on the analysis, the Index US30 may form a long-term SELL trend. Based on this analysis, we can try to enter a Sell position with a small risk margin.

Another Rally To Sell?The Dow rallied on higher volume and has gapped up on futures to the trend line, notice each rally is lower highs, is this one different?
We went short on a reversal last week and then closed our short mid session with an update...now we short again. The falls this week were on lower volume, a sign of minor wave two up which should be an ABC, the C rally part underway.
Gold has very likely topped for now, we said it was possible to $3400-500...now in correction mode before the next powerful wave five up to come.
Appreciate a thumbs up, good trading and God Bless you all!

Short-Term Opportunity in Dow Jones: Limited UpsideCurrently, I estimate that under the best-case scenario (black label), the Dow Jones is forming wave of wave B. This implies that the upside movement is likely to remain limited, with a potential retest of the 39,310–39,649 area.
Caution is advised for a possible reversal, especially if the Dow Jones fails to break above the 40,791 resistance level.


Trade Idea: US30 Long ( MARKET )Technical Justification:
Daily Chart:
• Oversold Conditions: RSI is at 35.90, approaching oversold.
• MACD is deeply negative (-905.428 / -831.781), signaling extended downside and a potential for a mean reversion bounce.
• Price recently bounced sharply off a support area around 37,800–38,000, forming a possible bullish rejection wick.
15-Min Chart:
• Bullish Divergence visible in RSI and MACD.
• RSI rebounded from sub-30 to 52.10, signaling strengthening momentum.
• MACD histogram has reduced in negativity, suggesting decreasing bearish pressure.
3-Min Chart:
• Clear short-term uptrend forming after a strong intraday drop.
• RSI 62.56 and MACD turning positive show bullish momentum building.
• Price just reclaimed a key intraday level (~38139) with follow-through.
⸻
Fundamental Bias:
Recent oversold market conditions, combined with potential short-term relief rally due to earnings optimism, Fed rate pause speculation, or geopolitical cooling, support a tactical long bias.
⸻
Trade Setup:
• Entry (Buy): 38,150
• Above the minor resistance turned support zone and confirmation of bullish momentum.
• Stop Loss (SL): 37,800
• Below the recent strong support zone from Daily and intraday.
• Take Profit (TP): 38,750
• Just below the next major resistance zone on the 15-min/1H chart. FUSIONMARKETS:US30

Daily Price Action DOW Jones DJI Tuesday 4/22/2025In this video, we will be looking into the potential price action of DJI.

Dow Jones in a Bear Market: Is Now the Time to Buy?Hello folks, it's Tradevietstock again. Today, global stock markets are facing a string of "red-hot" sessions after the U.S. announced tariffs on various countries. Let’s explore the mid-term investment opportunities and assess the risks and rewards in this complex environment.
I will gather data on the Dow Jones. Is a harsh winter on the horizon, or could this be a historic opportunity?
i. Dow Jones Index
1. Statistical analysis
Currently, the Dow Jones is down nearly 20% from its peak, with a steep decline that stands out as rare in its history. Such sharp drops are uncommon for the index.
Us Stock Market Index DJI - 2025 Stock Market Crash - The Biggest Bluff (Tradevietstock)
When filtering quantitative data, we can observe the following scenarios. The key takeaway from this analysis is that the Dow Jones is likely to form a major bottom, setting the stage for a strong upward cycle.
Based on probabilistic modeling, the Dow Jones is expected to hit its bottom from the 50th trading session onward, counting from April 4, 2025. The projected bottom range is approximately 32,184 to 33,717. The recent recovery doesn’t yet represent the major bottom, meaning we’ll need to wait longer for that turning point.
=> Conclusion: The Dow Jones has not yet formed its major bottom and likely needs to decline another 8% or so. However, the recent recovery marks the first sign that it’s gradually approaching a significant bottoming zone.
2. Market cycle analysis
The DJI has experienced multiple breakouts below the True Range Bands. These bands are calculated to determine the true range of price movement, meaning that each breakout is carefully considered as a potential reversal signal, indicating that the price is breaking away from its recent trend. However, this is not the only factor we use to guide our trading decisions. According to Cycle Theory, the DJI is currently in its Phase 1, which represents a bear market. This is further supported by the extreme bearish phase shown in the indicator below.
As shown in the example below, the DJI fell significantly after a strong rally, entering a bear market phase. Following this, the index experienced a small recovery after the Extreme Bearish Phase (highlighted by a red background) before retesting its recent bottom. At this stage, there’s a possibility that the DJI could form a lower low. This is why I emphasize the need for additional confirmation signals and statistical analysis before making any decisions.
The strongest confirmation signals for a new uptrend occur when the price breaks above the True Range Bands, as shown in the image below. This breakout happens only after all the other criteria, such as those mentioned earlier, have been met. This marks the beginning of an uptrend
ii. Sentiment Data
Currently, the market is in a zone of extreme fear, consistent with our previous analysis that a major bottom is forming in this region. The sentiment index is hovering around ~4 points, a low level comparable to August 5, 2024.
This panic isn’t limited to one region—global markets are in extreme turmoil, as shown by the CNN Fear and Greed Index. This indicator has dropped to the extreme fear zone, and historically, every time it hits this level, the S&P 500 forms a significant bottom.
=> Global markets are gripped by fear and chaos. This is a positive signal for picking up undervalued stocks. Whenever the Sentiment Index reaches this zone, markets tend to form major bottoms and rise in the mid-to-long term.

US30 – Descending Channel intact after False BreakoutFX:US30 is currently trading within a clearly defined descending channel, with price action continuously being restricted by the upper trendline. The recent decline indicates that sellers are in control, suggesting the possibility of continuation.
Price has recently broken through a key support area and may come back to retest it. If this level holds as support, it will reinforce the bearish structure and increase the likelihood of a move toward the 34,100 target, which aligns with the boundary of the channel.
As long as price remains below this support area, the bearish outlook remains intact. A false breakout may occur to "trap" buyers, so it is necessary to wait for clear reversal candle confirmation before entering a trade.
Remember, always confirm your setup and use appropriate risk management.

US30 - medium to long term opportunity setting upHello,
The US30 futures are forming a bullish pattern, signaling potential upside. The MACD and moving averages align, presenting a compelling opportunity for buyers.
Investors should note President Trump's aggressive push for Federal Reserve Chair Powell to cut interest rates, including threats to dismiss him if he resists. While this rhetoric could unsettle markets, we believe Trump is unlikely to follow through, as markets have likely found a bottom and he would avoid actions that could trigger a downturn.
Technical analysis supports early entry for bold investors, with a stop-loss placed below the recent low. Proceed with caution and good luck.
Disclosure: I am part of Trade Nation's Influencer program and receive a monthly fee for using their TradingView charts in my analysis.

US30 bearish play setting upThe hourly chart is in a downtrend, and we are at that trend line.
On the 15m chart, the momentum of buyers has slowed down to the point where sellers hit it hard as shown by the black arrow.
We want to see the "Last strong buyer" failing to make a new high (or creating a fake high), retesting the horizontal and price falling out of bed.
Waiting for the retest is best but price might not retest before dropping.

Sellers for us30 Strong breakout of my initial support zone. Now with the bears in full force I believe the market will retrace back up to the 50-66% fib zones before having another bear run to wedge channel support.

US30 | Massive Demand Zone Bounce – Is the Bull BackUS30 just tapped into a strong demand zone (38,166 – 38,287), and we’re now seeing bullish price reaction.
This zone has held up well despite recent heavy selling pressure.
Key Observations:
Demand zone reaction confirmed with strong bullish engulfing candle
Liquidity grab below the previous low – stop hunt?
Bullish momentum building as price reclaims 38,287 level
Next potential targets:
39,401 = minor resistance
40,549 = major supply zone (watch for reactions)
What to watch next:
Clean break & retest of 38,287 for confirmation
Possible early entries with tight risk below the zone
Strong upside potential if bullish momentum holds into the week
My Bias:
Bullish short-term. Looking for confirmations on retest.
SL below demand zone, targeting 39.4K and above.
What’s your take? Are you bullish or bearish on US30 right now? Drop your thoughts and charts in the comments!
#US30 #DowJones #SmartMoney #PriceAction #DemandZone #TradingSetup #BreakoutOrBounce #TradingView #LuxAlgo #SupplyAndDemand #TechnicalAnalysis

Bullish ideaUS30 may rise if it remains above 36,000 as it is a halfway mark of the previous bull run.
As long as price is above 36,400 and 37,000, the indice may try to reach 39,000 and 40,500.
Price action is oscillating between 42,500 and 36,400.

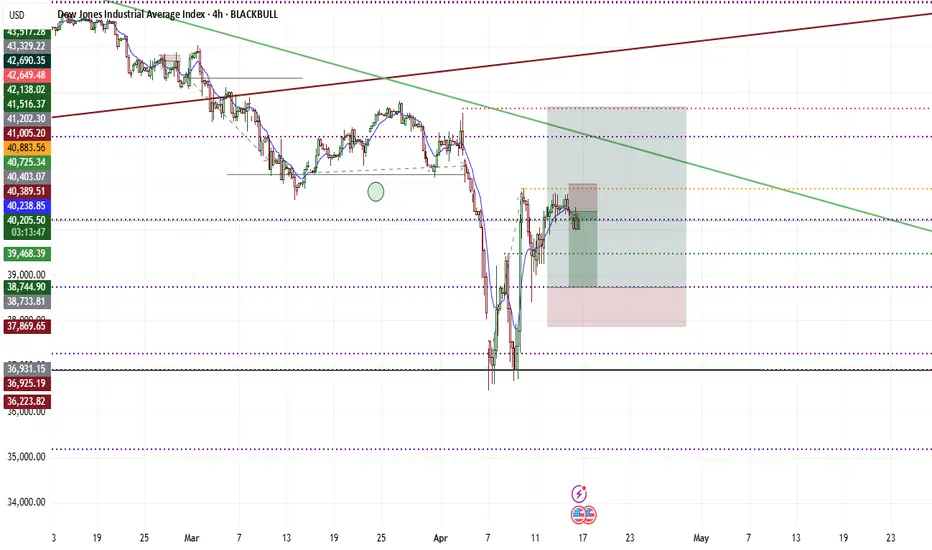
Drop followed followed by long.Dow Jones is currently attempting to continue its bullish resurgence, but has failed to do so by failing to stabilise above 40,883. As long as price action is under the 40k mark, the points may likely retest the previous support barriers, situated between 39,500 and 38,750, as likely bullish catalysts for a long opportunity. However, by failing to go down, breaking, and stabilising above 40,883, the price may continue going up, targeting 42,600 and 42,000.
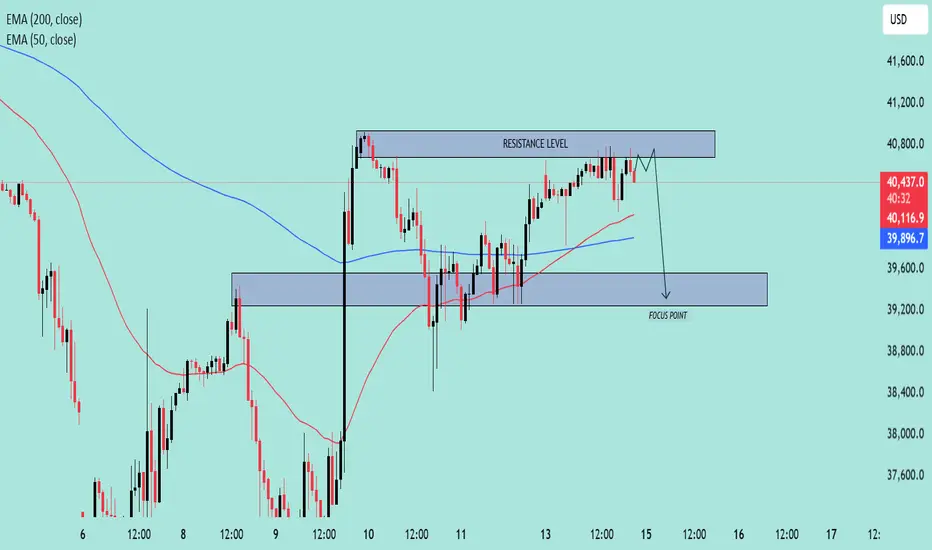
US30 Approaching Key Resistance–Potential Reversal Setup in Play🧠 Chart Overview
Asset: US30 (likely the Dow Jones Industrial Average)
Timeframe: Appears to be 1H or 2H
Indicators:
EMA 50 (Red): 40,119.5
EMA 200 (Blue): 39,897.3
Price at time of chart: Around 40,503
🔍 Key Technical Levels
🔴 Resistance Zone
Range: ~40,750 to 40,850
Price has tested this level multiple times and is currently hovering near it.
The resistance is holding, and no strong breakout has occurred.
🟦 Support / Focus Zone
Range: ~39,200 to 39,600
Marked as the “FOCUS POINT” – likely the expected target on a breakdown.
EMAs Insight:
Price is above both the 50 EMA and 200 EMA, suggesting short-term bullishness.
However, since it’s stalling at resistance, it could flip bearish on rejection.
🧭 Price Action Narrative
The chart suggests a potential fakeout above resistance, followed by a sharp rejection.
The path drawn shows a short-term dip, targeting the FOCUS POINT (support zone).
Rejection at resistance aligns with typical distribution behavior.
📌 Trade Idea (Bearish Bias)
Entry Idea: Short near or just above the resistance level (~40,800)
Target: 39,400 zone
Stop-Loss: Above the resistance level (~40,900+)
Risk/Reward: Favorable if price fails to break above resistance convincingly
📉 Bias: Bearish Reversal
Unless price breaks and closes above resistance with strong momentum, the chart favors a pullback scenario.
Dow Jones Potential DownsidesHey Traders, in the coming week we are monitoring US30 for a selling opportunity around 39700 zone, Dow Jones is trading in a downtrend and currently is in a correction phase in which it is approaching the trend at 39700 support and resistance area.
Trade safe, Joe.

