NAS100USD: Institutional Support Fuels Bullish MomentumGreetings Traders,
In today’s analysis of NAS100USD, we observe that institutional order flow remains bullish, and as such, we aim to align our trading opportunities with this directional bias.
Key Observations:
Institutional Support Zones:
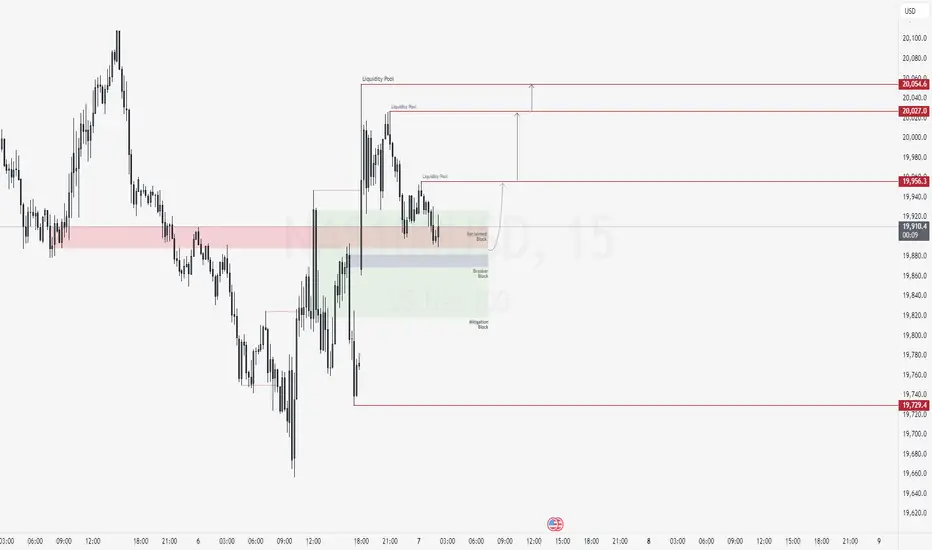
Price has recently retraced into a significant institutional support area—a large mitigation block, where smart money typically mitigates previous sell orders and initiates new buy orders. This zone is further reinforced by the presence of a reclaimed order block, signaling an area where prior institutional buying occurred and may now be re-engaged.
Confluence of Bullish Arrays:
The alignment of the mitigation block, reclaimed order block, and an adjacent breaker block provides strong confluence. While price is currently showing signs of rejection at this zone, it is important to exercise patience and wait for confirmation before entering, especially given the size of the mitigation block.
Trading Strategy:
Upon confirmation, we will look to initiate long positions from these institutional support levels, targeting liquidity pools resting in premium pricing zones where buy-side liquidity is likely to reside.
Stay disciplined and let the market confirm your narrative.
Kind Regards,
The Architect
NDX trade ideas
NAS100 buy now more than 1-10RRNAS100 buy now more than 1-10RR. The Ideia I shared before is confirmed for me. Lets see

NASDAQ: 50% probability that this Golden Cross is bearish.Nasdaq is bullish on its 1D technical outlook (RSI = 60.920, MACD = 61.810, ADX = 33.031) as it continues its recovery from the Low of the previous month. In the meantime, it formed a 4H Golden Cross, the first since January 23rd. Even though this is a bullish pattern theoretically, it often doesn't deliver an immediate rise. More specifically, since the October 2022 market bottom, Nasdaq has had another 10 Golden Crosses on the 4H timeframe. The interesting statistic is that 5 have extended their rallies but the other 5 cuased a pullback (short or medium term). Consequently we call for caution in the next 2 weeks, as the market may correct towards the 4H MA200 before it resumes the long term uptrend.
## If you like our free content follow our profile to get more daily ideas. ##
## Comments and likes are greatly appreciated. ##

5 May Weekly NAS100 Forecast USTECH: Trade Talks and Fed Decision in Focus
Analysis:
Markets are at a pivotal juncture as investors monitor two critical developments: the potential resumption of U.S.-China trade negotiations and the Federal Reserve's upcoming policy decision.
Trade Negotiations: Renewed dialogue between the U.S. and China could alleviate tariff pressures, stabilize global supply chains, and bolster investor confidence, thereby reducing recession risks.
Federal Reserve Decision: The Federal Open Market Committee (FOMC) is scheduled to meet on May 6–7, 2025. While the Fed is widely expected to maintain the current interest rate range of 4.25%–4.50%, market participants are keenly awaiting Chair Jerome Powell's commentary for insights into future monetary policy directions.
Market Bias: Cautiously Bullish
The confluence of potential trade resolutions and a steady monetary policy stance supports a cautiously optimistic outlook. However, market volatility may persist pending concrete developments.
Key Levels to Watch:
USTECH (NASDAQ 100):
Resistance: 20 531
Support: 19 481
Conclusion:
Investors should remain vigilant, monitoring both geopolitical developments and central bank communications, as these factors will significantly influence market trajectories in the near term.
---
Disclaimer: This analysis is for informational purposes only and does not constitute investment advice. Always conduct your own research before making trading decisions.
---


NASDAQ (NDX) Market OutlookCurrently, the NASDAQ is trading around 19,723. We're anticipating a short-term pullback toward the 19,462 level, where a significant pool of liquidity awaits. This zone could act as a magnet for price in the near term. Once price reaches this area, we’ll closely monitor the lower timeframes for a potential bullish reaction or accumulation, which could signal the next leg higher.
Stay patient and let price confirm at key levels.

US100 continues its bullish TrendUS100 continues its bullish Trend. Fundamental & sentiments after FOMC meeting appears to be favorable for equity markets.

Nasdaq The current structure has an imbalance so a collapse is expected from my side plus we have a bearish flag formed waiting breakout towards the lowest low of the structure

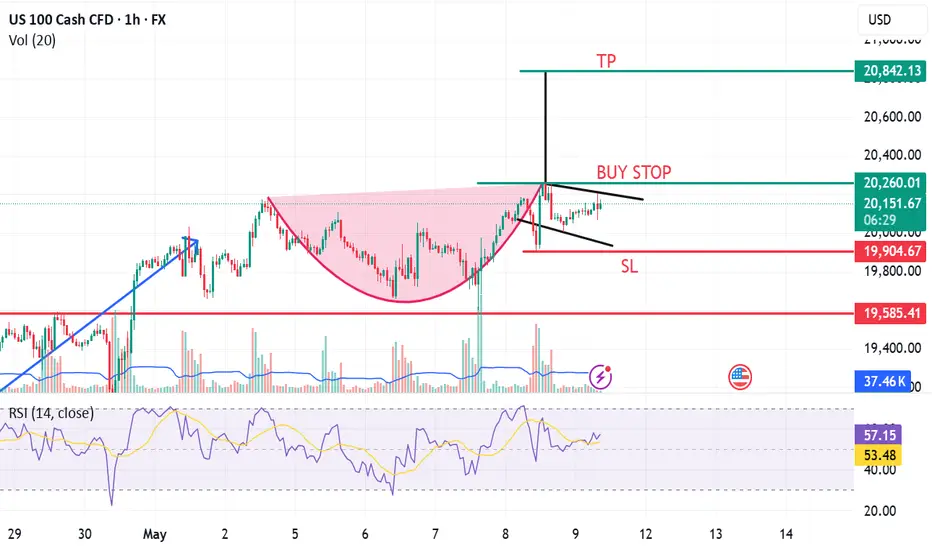
Nasdaq-100 H4 | Falling toward a pullback supportThe Nasdaq-100 (NAS100) is falling towards a pullback support and could potentially bounce off this level to climb higher.
Buy entry is at 19,595.55 which is a pullback support.
Stop loss is at 18,900.00 which is a level that lies underneath an overlap support.
Take profit is at 20,343.35 which is a swing-high resistance.
High Risk Investment Warning
Trading Forex/CFDs on margin carries a high level of risk and may not be suitable for all investors. Leverage can work against you.
Stratos Markets Limited (tradu.com):
CFDs are complex instruments and come with a high risk of losing money rapidly due to leverage. 63% of retail investor accounts lose money when trading CFDs with this provider. You should consider whether you understand how CFDs work and whether you can afford to take the high risk of losing your money.
Stratos Europe Ltd (tradu.com):
CFDs are complex instruments and come with a high risk of losing money rapidly due to leverage. 63% of retail investor accounts lose money when trading CFDs with this provider. You should consider whether you understand how CFDs work and whether you can afford to take the high risk of losing your money.
Stratos Global LLC (tradu.com):
Losses can exceed deposits.
Please be advised that the information presented on TradingView is provided to Tradu (‘Company’, ‘we’) by a third-party provider (‘TFA Global Pte Ltd’). Please be reminded that you are solely responsible for the trading decisions on your account. There is a very high degree of risk involved in trading. Any information and/or content is intended entirely for research, educational and informational purposes only and does not constitute investment or consultation advice or investment strategy. The information is not tailored to the investment needs of any specific person and therefore does not involve a consideration of any of the investment objectives, financial situation or needs of any viewer that may receive it. Kindly also note that past performance is not a reliable indicator of future results. Actual results may differ materially from those anticipated in forward-looking or past performance statements. We assume no liability as to the accuracy or completeness of any of the information and/or content provided herein and the Company cannot be held responsible for any omission, mistake nor for any loss or damage including without limitation to any loss of profit which may arise from reliance on any information supplied by TFA Global Pte Ltd.
The speaker(s) is neither an employee, agent nor representative of Tradu and is therefore acting independently. The opinions given are their own, constitute general market commentary, and do not constitute the opinion or advice of Tradu or any form of personal or investment advice. Tradu neither endorses nor guarantees offerings of third-party speakers, nor is Tradu responsible for the content, veracity or opinions of third-party speakers, presenters or participants.

NASDAQ-100 Head & Shoulders Breakdown?I've been tracking a potential head and shoulders pattern on the NASDAQ-100, with a neckline at 17,720. If the pattern completes and breaks down convincingly, the measured move projects a target near 13,200 — a significant potential drop.
While technical patterns aren’t guarantees, they often coincide with underlying fundamentals. In this case, there are several macroeconomic headwinds that could catalyze such a decline:
Sticky Inflation and Interest Rate Uncertainty: Despite some progress, inflation remains above the Fed’s target. A “higher for longer” rate environment continues to pressure equity valuations, especially in tech-heavy indexes like the NASDAQ-100.
Weakening Consumer and Corporate Spending: Retail sales and corporate earnings revisions have shown signs of fatigue, suggesting slowing momentum in key economic drivers.
Global Tensions and Supply Chain Risks: Ongoing geopolitical instability, including issues in the Middle East and renewed U.S.–China trade rhetoric, could reignite volatility and affect global growth assumptions.
Overvaluation and Narrow Market Breadth: A small group of mega-cap tech names have driven much of the recent rally, leaving the broader market vulnerable if leadership falters.
With technical and fundamental factors aligning, this setup is worth watching closely. A confirmed break below the neckline could be more than just a chart pattern—it may reflect a broader shift in sentiment.

Long-term bearish to 14kJust adding to the idea previously posted:
A black upward trendline shows a strong bullish trend from mid-2022 through early 2025. Recently, there’s been a significant breakdown below this trendline, which signals a substantial change in trend from bullish to bearish. On Friday, we tested and rejected this trendline, which at the same time tested a 65% (golden pocket) retracement of the recent move, indicating a possible resistance area after a strong rebound.
I expect the price not to break this level any further.
The target remains 14k and below.

Understanding the Crab's Potential Ascent Before the DescentCurrent market analysis suggests a potential temporary surge in the Nasdaq index, colloquially referred to as a "crab walk," possibly reaching a level of 20.4 before a significant correction.
While this upward movement may present short-term opportunities, it is crucial to recognize its potential transience.

X2: NQ/US100/NAS100 Short - Day Trades 1:2X2:
Risking 1% to make 2%
NAS100, US100, NQ, NASDAQ Short for day trade, with my back testing of this strategy, it hits multiple possible take profits, manage your position accordingly.
Risking 1% to make 2%
Use proper risk management
Looks like good trade.
Lets monitor.
Use proper risk management.
Disclaimer: only idea, not advice

X2: NQ/US100/NAS100 Long - Day Trades 1:2X2:
Risking 1% to make 2%
NAS100, US100, NQ, NASDAQ Long for day trade, with my back testing of this strategy, it hits multiple possible take profits, manage your position accordingly.
Risking 1% to make 2%
Use proper risk management
Looks like good trade.
Lets monitor.
Use proper risk management.
Disclaimer: only idea, not advice

NAS100 BUY Trade ideia. 1-10RRNAS100 BUY Trade ideia. 1-10RR. After the TP hit from yesterday Im still expecting more bullish momentum so Im waiting to see if I can get this 1-10RR or at least 1-5RR from this. Remember we need confirmations to enter the trade. It has to brake structure in 5min before we enter.
Lets see

The Nasdaq 100’s rally may be coming to an endThe Nasdaq 100 has staged an impressive rally over the past two weeks, climbing more than 12% since Monday 21 April to close at roughly 19,970 on Monday 5 May. However, if there were a point at which the advance might pause, it could be near current levels. The index has risen to a key area of technical resistance in the 19,900 to 20,200 range, which could prove challenging to break through, especially given the uncertain outlook.
One driver behind the Nasdaq 100’s rise has been the fall in implied volatility, as indicated by the VXN. While the better-known Vix measures expected volatility in the S&P 500 over the next month of trading, the VXN measures volatility on the Nasdaq 100. It has recently dropped to a reading of 25.7, down from more than 50 in April, as shown on the chart below. This decline in implied volatility probably triggered significant unwinding of put positions in the options market, allowing market-maker hedging flows to provide a tailwind for stocks. But with the VXN now back at levels last seen on 2 April, this tailwind may no longer be available to support the market.
Additionally, the Nasdaq 100 has returned to the 61.8% retracement level, a significant Fibonacci level that frequently acts as strong resistance and could help determine whether the recent rebound is genuine or merely a short-term blip. Just above this 61.8% retracement lies the 200-day moving average, another level that typically provides strong resistance. Furthermore, the 19,950 region has consistently acted as both support and resistance, dating back to June 2024. With these three resistance areas converging, it may be challenging for the tech-heavy index to sustain its upward momentum. Should stocks begin to reverse lower, initial support may be around 19,300, followed by a gap at 18,240.
That said, if the Nasdaq 100 somehow manages to overcome all these hurdles, it could rise to 21,100 – though such a move appears unlikely at this stage.
Written by Michael J. Kramer, founder of Mott Capital Management
Disclaimer: CMC Markets is an execution-only service provider. The material (whether or not it states any opinions) is for general information purposes only and does not take into account your personal circumstances or objectives. Nothing in this material is (or should be considered to be) financial, investment or other advice on which reliance should be placed.
No opinion given in the material constitutes a recommendation by CMC Markets or the author that any particular investment, security, transaction, or investment strategy is suitable for any specific person. The material has not been prepared in accordance with legal requirements designed to promote the independence of investment research. Although we are not specifically prevented from dealing before providing this material, we do not seek to take advantage of the material prior to its dissemination.

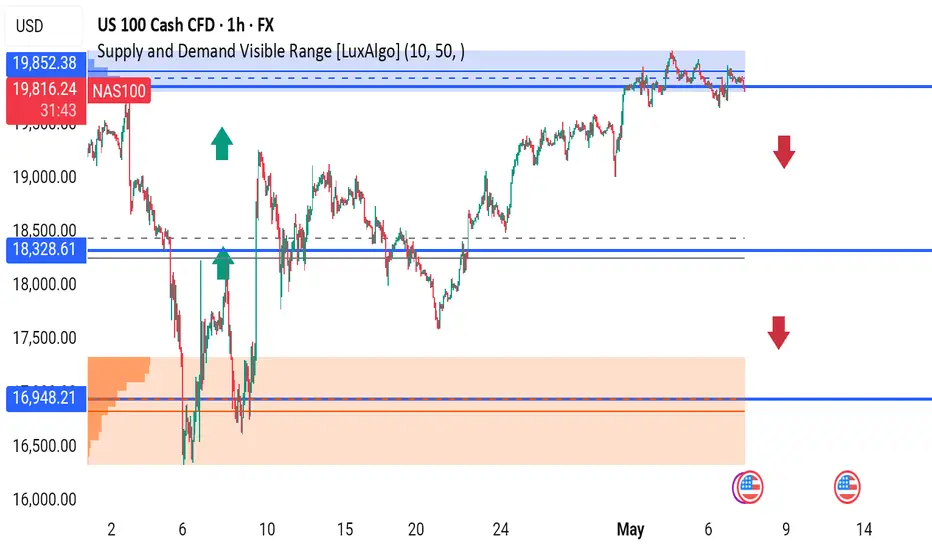
NAS100 1H | Major Rejection Zone – Time to Sell?NAS100 is trading inside a key supply zone, showing clear rejection signs near 19,825, with a potential downside move on the table.
Watch These Levels:
Resistance (Rejection Zone): 19,825
First Support: 18,328
Major Demand Zone: 16,948
Bearish Bias if price fails to break and close above 19,825.
A break below 18,328 could trigger a deeper drop toward 16,948.
Trade Plan:
Sell near 19,825 with SL above zone
Target 18,328 → 16,948
Bullish reversal only above clean breakout
What do you think—pullback or breakout?
#NAS100 #NASDAQ #Indices #PriceAction #SupplyAndDemand #SmartMoney #ForexTrading #TechnicalAnalysis #LuxAlgo #US100 #CFD
REPEATING 2022 PATTERN?We humans love to see patterns so we can try to understand our own existence and our perception of almost everything.
Very interesting comparison between 2022 and 2025. Though market conditions seem different we can see clearly the failed attempt to break above de 200 SMA in 2022. It may repeat again.

NAS100USD: Volatility Opens Door for Sell Setup in NY SessionGreetings Traders,
As we enter the New York session—a period known for heightened volatility—we note that NAS100USD remains in a broader bullish environment. However, current price action suggests the potential for a short-term reversal, prompting us to explore selling opportunities.
Key Observations:
1. Bearish Internal Structure Developing:
Despite the overall bullish trend, internal price action reveals a sequence of lower lows, indicating the formation of a bearish microstructure. This internal weakness is reflected in the way bearish arrays—such as mitigation blocks and fair value gaps (FVGs)—continue to act as resistance zones.
2. Mitigation Block & FVG Alignment:
Recently, price delivered a strong displacement to the downside, followed by a retracement into a mitigation block that aligns with a fair value gap. This confluence reinforces the bearish bias and suggests institutional selling may be active in this zone.
3. Downside Targets – Gap Fill & Liquidity Pools:
The first downside target is a nearby inefficiency (gap) in price action, which the market often seeks to fill. The second target lies below, where sell-side liquidity pools are likely resting.
Trading Plan:
Monitor price behavior within the current resistance zone. If confirmation of continued bearish momentum appears, short positions targeting the aforementioned levels may be viable.
Stay focused and wait for confirmation before committing to any positions.
Kind Regards,
The Architect

US100 WILL GO DOWN|SHORT|
✅US100 price grew again to retest the resistance of 20,300
But it is a strong key level
And we are already seeing
A local bearish pullback
So I think that there is a high chance
That we will see a bearish move down
SHORT🔥
✅Like and subscribe to never miss a new idea!✅
Disclosure: I am part of Trade Nation's Influencer program and receive a monthly fee for using their TradingView charts in my analysis.

Nas100 Long trade ideias. 2 possible Entry pointsNas100 Long trade ideias. 2 possible Entry points. Please wait for a brake of structure in 5min in one of these entry points. My favorite would be the lowest one but lets see.
Lets have a profitable week.

lazy bullsI guess we need something to make bulls work, cuz i don't know what we are doing if it is not buying.