NASDAQ SCENARIO 27/04/2025English : According to our analysis, we anticipate a BULLISHscenario.
Morocan Darija : kanchofo d'apres l'analyse dyalna antsanaw TLOO3
ATENTION : I only share my ideas, not signals
NDX trade ideas

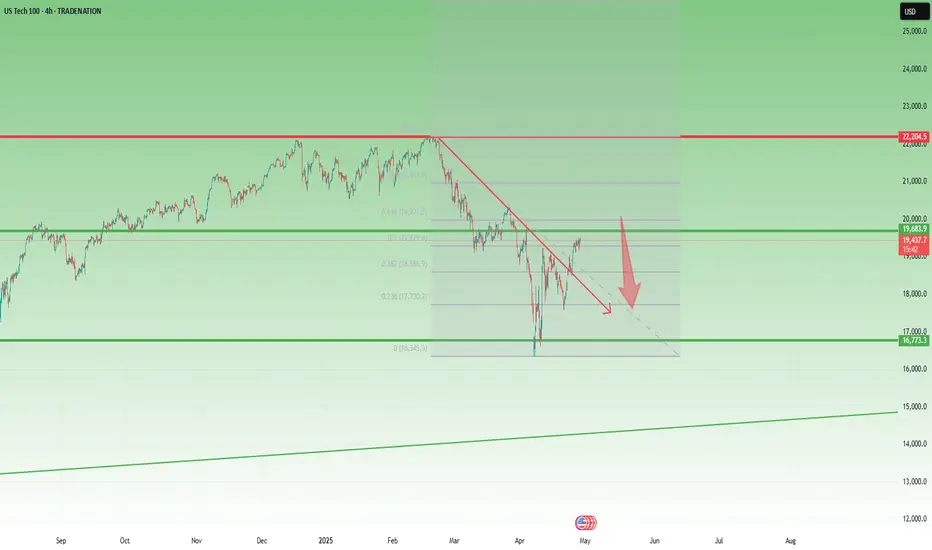
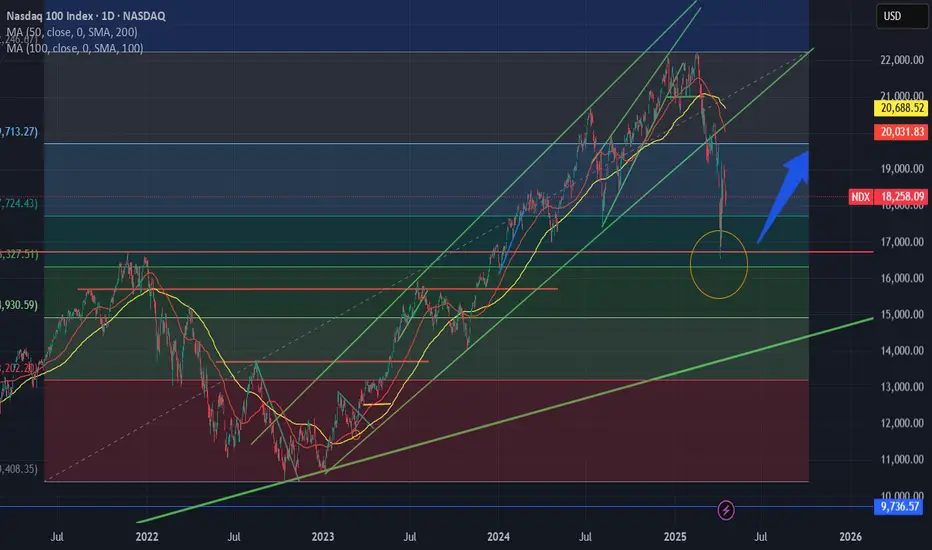
NASDAQ Recovery Looks Fragile Below 20,500After the steep drop to 16,300, NAS100 started to recover, forming a higher low and managing to break back above the falling trendline drawn from the all-time high (ATH).
While these are positive developments, in my opinion, the trend is likely to reverse to the downside soon.
Technically, the index is now entering a heavy resistance zone, marked by:
• The golden sell zone between the 50% and 61.8% Fibonacci retracement,
• Psychological resistance at 20,000,
• Major horizontal resistance around 20,500.
As long as the price remains below 20,500, I favor short trades, targeting a potential drop to at least 18,000
Disclosure: I am part of Trade Nation's Influencer program and receive a monthly fee for using their TradingView charts in my analyses and educational articles.
NASDAQ: Rejected on the 1D MA50. Can it break it?Nasdaq is neutral on its 1D technical outlook (RSI = 52.608, MACD = -100.810, ADX = 23.609) as it got rejected today on the 1D MA50. That is the first serious Resistance test of the April 7th rebound and until it breaks, we can see a technical pullback to the 4H MA100 in order to establish the new Support. With the 1D RSI confirmed the new long term bottom with a DB, buying the dips on every such pullback is the most effective strategy on such occasions. Our short term target is the R1 level (TP = 20,300).
## If you like our free content follow our profile to get more daily ideas. ##
## Comments and likes are greatly appreciated. ##

Possible reversal of this bullish wave...(LOG)Orange circles highlight repeated price rejection and the formed doji that suggests a slowdown in a bullish wave and potential reversal. The confluence of the descending trendline and horizontal supply/resistance zone creates a high-probability reversal or breakout from this triangle.
If the price rejects again from the current supply zone and triangle, short setup toward the Fibonacci retracements or demand zones (18300 and below).
If the price breaks above the descending trendline, bullish continuation will likely target 20,000+ (Swing H).
Trend remains down.
Entry 19300
TP 18300 below
Target 14k.

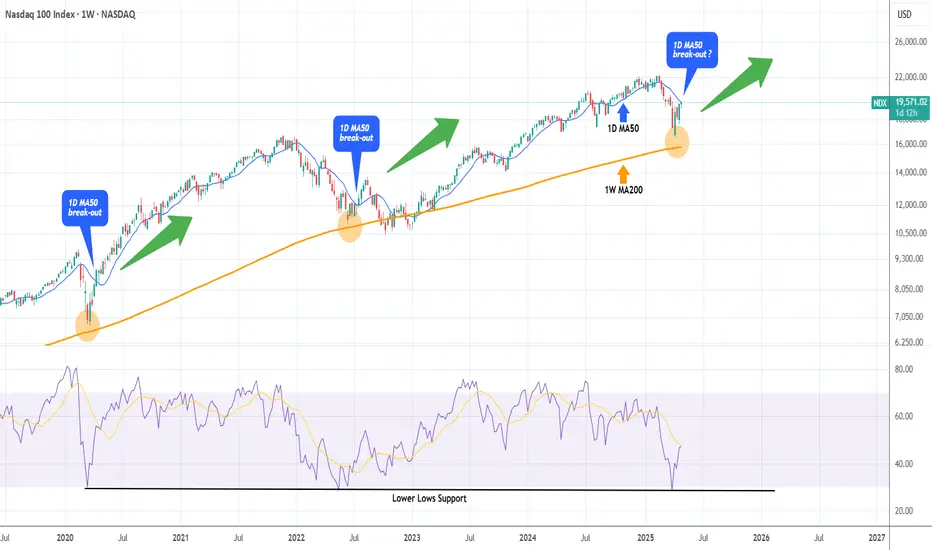
NASDAQ testing its 1D MA50. Break-out or Fake-out?Nasdaq (NDX) has reached its 1D MA50 (blue trend-line) for the first time since February 24. Following the (near) rebound on the 1W MA200 (orange trend-line), this looks like a textbook recovery from a correction to a new long-term Bullish Leg.
Chronologically the last such correction was the March 2020 COVID flash crash, which after it almost touched the 1W MA200, it recovered as fast as the current rebound and when it broke above its 1D MA50, it turned it into the Support of the new long-term Bullish Leg.
What wasn't a break-out but a fake-out was the rebound after the June 13 2022 (near) 1W MA200 rebound, when the break above the 1D MA50 was false as it produced a new rejection and sell-off later on. The difference is that 2022 was a technical Bear Cycle both in terms of length and strength.
Whatever the case, Nasdaq has seen the lowest 1W RSI (oversold) reading among those 3 bottoms. So do you think today's 1D MA50 test is a break-out or fake-out?
-------------------------------------------------------------------------------
** Please LIKE 👍, FOLLOW ✅, SHARE 🙌 and COMMENT ✍ if you enjoy this idea! Also share your ideas and charts in the comments section below! This is best way to keep it relevant, support us, keep the content here free and allow the idea to reach as many people as possible. **
-------------------------------------------------------------------------------
💸💸💸💸💸💸
👇 👇 👇 👇 👇 👇
Nasdaq: Where should I buy from next? New bullish orderblockWe are hunting the next buyzone already. The correction zone is printing now.
This is how you accurately forecast your next entry ahead of time. Learn how corrections should work. Long below higher time frame (Hourly/Daily/Weekly) lows is the name of the game.
This should be easy work, and you can feel free to look for longs below 15m lows on the way to the targets above. Once we hit those, we should look for correction after closing below hourly candles, the same way we were able to freely take long after close above hourly candles today just as I prescribed while it was dropping.
This is just the rules of the game 🔓 gotta be sharp enough to observe them and trust the mechanics. Thanks for tuning in

NASDAQ BUYING SETUP Market break h4 structure now we gonna long in Nasdaq for 20290 20650 is my tp 🤩💸
Don't miss this opportunity to make some good profit 🙏
More details message us

NAS100 BUY Trade ideiaNAS100 Long move trade ideia. Expecting to see trade reach this target.
Please move SL to BE once it hits 1-1RR.

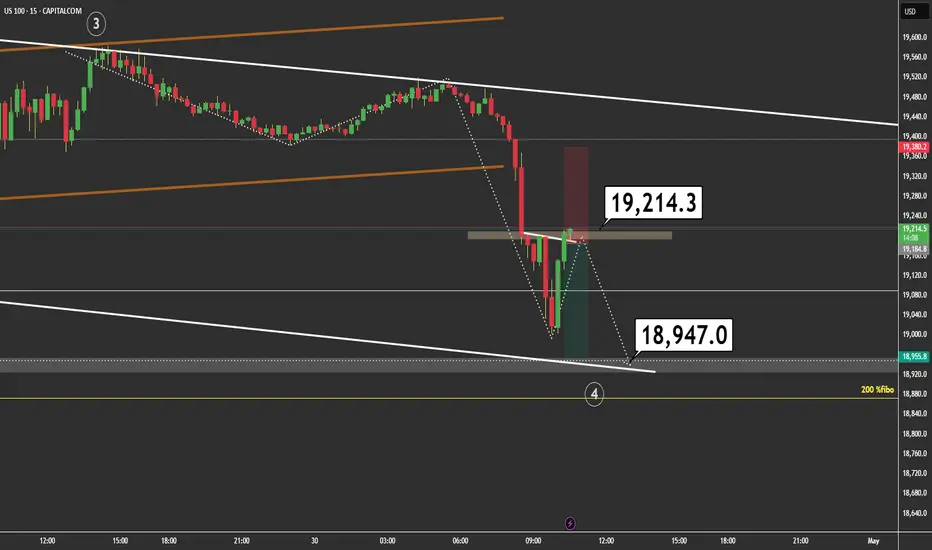
Hits Supply ZoneAfter a sharp drop, price is retracing and reacting to the 19,214.3 resistance zone.
Still inside a descending channel, targeting 18,947.0, where dynamic support and the 200% Fibonacci extension align.
🎯 Entry: Clear rejection from resistance
🛑 Stop: 19,380
✅ Target: 18,947
⚠️ Active management recommended – possible reaction at mid-channel
Structure still confirms bearish momentum (wave 4 in progress). Watch out for fake breakouts!
NASDAQ Potential UpsidesHey Traders, in today's trading session we are monitoring NAS100 for a buying opportunity around 19250 zone, NASDAQ is trading in an uptrend and currently is in a correction phase in which it is approaching the trend at 19250 support and resistance area.
Trade safe, Joe.
Following the Wave StructureAnalysis:
The NASDAQ100 appears to be following a classic 5-wave structure.
Currently, we are finishing Wave 3, with an expected corrective move toward the 50% Fibonacci retracement zone near 19,018.7.
From there, the chart suggests a continuation toward the 19,879 area (close to the daily 200 EMA) and, finally, toward the 20,866 target, completing the cycle.
Key zones:
Support: 19,018.7 (50% Fibo and strong structural level)
Resistance: 19,879.1 and 20,866.2
Additional levels: Daily 200 EMA and previous structural gaps
The path won't be in a straight line — expect consolidation and pullbacks along the way. However, the bullish projection remains intact as long as the 19,018.7 support holds.
Let's keep riding the wave! 🌊


Long - assuming nothing else blows upThe recent drop seems to be due by policy that is still ambiguous and evolving, good chance trade war dies down when deals are made. other than that, NDX bounced off a previous high and has momentum to at least revert to the ma
NAS100USD: Bullish Scalping Opportunity from SupportGreetings Traders,
In today’s analysis of NAS100USD, we identify bullish institutional order flow, and as such, we aim to align with this narrative by seeking buying opportunities.
This setup presents a scalping opportunity on the lower timeframes, with price currently reacting to a bullish order block serving as a key institutional support zone. Upon confirmation, we anticipate a move toward the liquidity pool in premium pricing, which will serve as our target zone for profit-taking.
As always, remain disciplined, wait for clear confirmation, and manage risk accordingly.
Kind Regards,
The Architect

Technical and digital analysisWe notice that we are in an upward correction and there is an increase in momentum. We are waiting for sellers to weaken in order to buy

NASDAQ INDEX (US100): Move Up Ahead
I think that US100 is going to bounce.
The price is currently retesting a recently broken
key daily horizontal resistance.
We see a strong positive bullish reaction to that.
Next resistance - 19779
❤️Please, support my work with like, thank you!❤️

NAS - Move to the downsideTechnicals, trend and price-action is hinting towards a drop on NAS, that needs to respect 19478. I'm earmarking a 'loaded' push from there to 19571 and then conclude for the week.
Happy trading!

NAS100... 4h chat pattern Your NAS100 (Nasdaq-100 index) *sell setup* looks like this:
* *Entry (Sell):* 1983
* *1st Target (TP1):* 1845
* *2nd Target (TP2):* 1800
This is a *bearish trade, targeting a roughly **138-point* drop for TP1 and *183-point* drop for TP2.
To evaluate this trade, consider the following:
### 1. *Technical Context*
* Is there a *resistance level* or *reversal pattern* around 1983?
* Are *momentum indicators* like RSI or MACD showing bearish divergence?
* What does the *volume* say — decreasing on up moves, increasing on down moves?
### 2. *Risk Management*
* Where is your *stop loss*? (This is critical to protect against a reversal.)
* What's the *risk-to-reward ratio*? Ideally, aim for 1:2 or better.
* Are you risking a fixed % of your capital (e.g., 1–2%)

NASDAQ Buy idea🔸 Structure Breakout → Pullback → Consolidation beneath resistance
🔸 Support Zone Multiple rejections from 19,370–19,385 demand zone
🔸 Liquidity Stops likely resting above 19,420 → potential fuel for breakout move
🔸 Candle Behavior Strong rejection candles from demand zone + no bearish follow-through
🔸 Momentum Price failing to make lower lows → bullish pressure building

NAS100 SELLGiven the resistance levels and the hidden divergence, it returned to the previous support level.

Bullish bounce?NAS100 is falling towards the support level which is an overlap support that is slightly above the 38.2% Fibonacci retracement and could bounce from this level to our take profit.
Entry: 18,908.67
Why we like it:
There is an overlap support level that is slightly above the 38.2% Fibonacci retracement.
Stop loss: 18,461.05
Why we like it:
There is an overlap support that lines up with the 50% Fibonacci retracement.
Take profit: 20,200.53
Why we like it:
There is an overlap resistance level that is slightly above the 161.8% Fibonacci extension.
Enjoying your TradingView experience? Review us!
Please be advised that the information presented on TradingView is provided to Vantage (‘Vantage Global Limited’, ‘we’) by a third-party provider (‘Everest Fortune Group’). Please be reminded that you are solely responsible for the trading decisions on your account. There is a very high degree of risk involved in trading. Any information and/or content is intended entirely for research, educational and informational purposes only and does not constitute investment or consultation advice or investment strategy. The information is not tailored to the investment needs of any specific person and therefore does not involve a consideration of any of the investment objectives, financial situation or needs of any viewer that may receive it. Kindly also note that past performance is not a reliable indicator of future results. Actual results may differ materially from those anticipated in forward-looking or past performance statements. We assume no liability as to the accuracy or completeness of any of the information and/or content provided herein and the Company cannot be held responsible for any omission, mistake nor for any loss or damage including without limitation to any loss of profit which may arise from reliance on any information supplied by Everest Fortune Group.

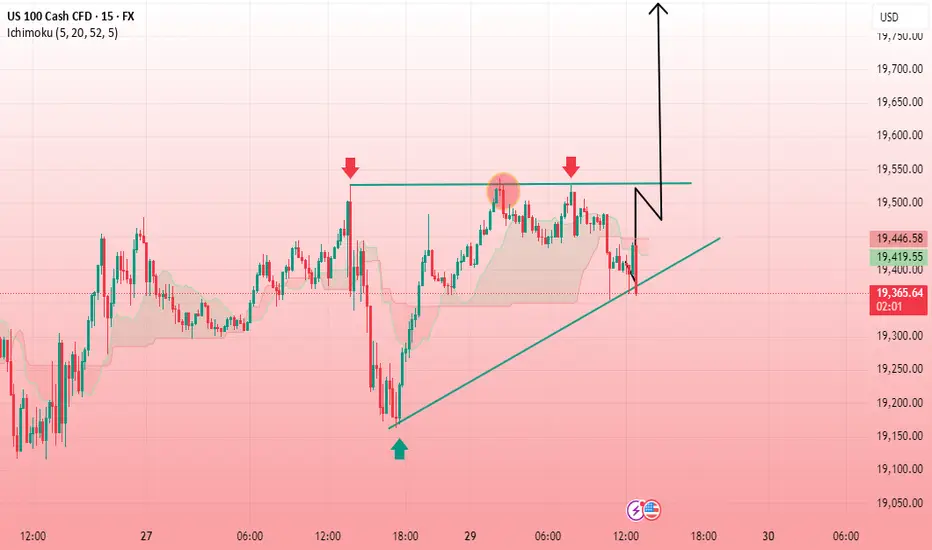
USNAS100 30M CHART PATTERN echnical Analysis Summary
Chart Pattern Observed:
The chart shows a clear ascending triangle pattern, which is a bullish continuation pattern. This is formed by a horizontal resistance level (around 19,550) and a rising trendline (higher lows), suggesting buying pressure is building up.
Key Levels:
Resistance Zone: 19,550
Support Trendline: Rising from ~19,050 to current level
Current Price: ~19,580
Breakout Target: 19,800.00 (as marked)
Interpretation:
Price has tested the 19,550 resistance multiple times without breaking lower significantly, indicating strength.
A breakout above this resistance would confirm the bullish triangle pattern.
The projected target, calculated using the height of the triangle added to the breakout level, is around 19,800.
Volume confirmation would further strengthen the breakout's validity (not shown here).
Potential Strategy:
Buy on breakout above 19,550, ideally with volume confirmation.
Take Profit: Around 19,800, per the measured move projection
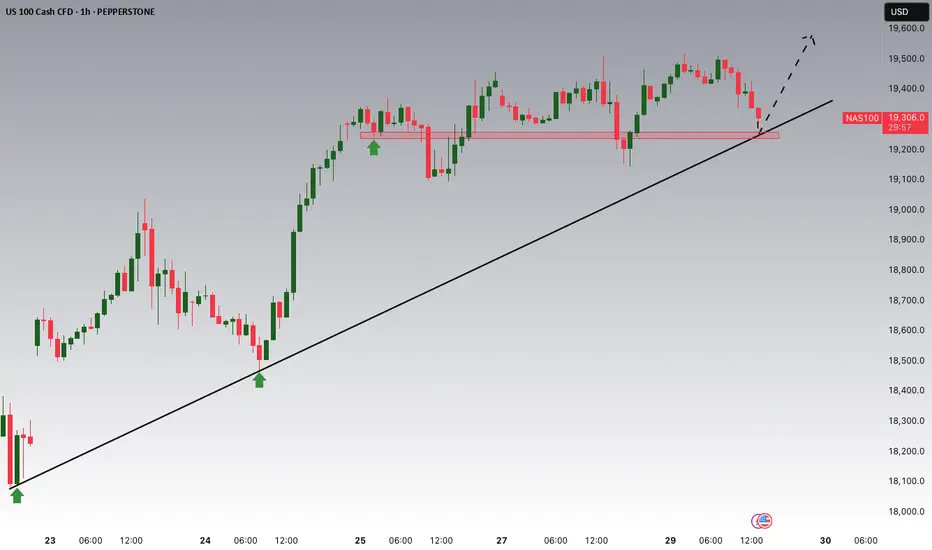
NASdaq_ Bullish trendline check and breakoutToday the Nasdaq made a Bullish trendline check and breakout to the up-side. Looks to be a sustainable rally. Also the Ichimoku is breaking out on the daily.
If you have hedge positions this the potential BULL rally you might need to manage those position through.
Seems we are lining up for good news, Bullish narrative: Ukraine mineral deal, May 06-07 interest rate cut, trade deals with India, Japan, Italy Australia, Mexico, Russian Ukraine peace deal. after that who knows
