NSDQ100 INTRADAY awaits Fed Rate Decision Macro & Central Banks
The Federal Reserve is expected to keep interest rates unchanged. Officials say policy is well-positioned, despite political frustration.
China is adding stimulus: cutting rates, reducing bank reserve requirements, and increasing gold reserves for the sixth month in a row.
Markets
U.S. stock futures are higher.
The U.S. dollar is recovering after three days of declines.
The U.S. and China will restart trade talks — the first since the Trump-era tariff war.
Companies
Novo Nordisk shares are rising on expectations of less competition for its obesity drug Wegovy.
WeightWatchers has filed for bankruptcy.
Earnings reports this morning: Walt Disney, Uber, Barrick Gold.
Earnings reports this afternoon: Arm Holdings, Occidental Petroleum, Carvana, Flutter.
Key Support and Resistance Levels
Resistance Level 1: 20,190
Resistance Level 2: 20,510
Resistance Level 3: 20,930
Support Level 1: 19,330
Support Level 2: 19,020
Support Level 3: 18,570
This communication is for informational purposes only and should not be viewed as any form of recommendation as to a particular course of action or as investment advice. It is not intended as an offer or solicitation for the purchase or sale of any financial instrument or as an official confirmation of any transaction. Opinions, estimates and assumptions expressed herein are made as of the date of this communication and are subject to change without notice. This communication has been prepared based upon information, including market prices, data and other information, believed to be reliable; however, Trade Nation does not warrant its completeness or accuracy. All market prices and market data contained in or attached to this communication are indicative and subject to change without notice.
NDX trade ideas

Technical Breakdown on US100 | 1H TimeframeHere’s a professional technical breakdown of the US100 Cash CFD (1H timeframe) using Volume Profile, Gann, and CVD + ADX indicators:
1. Key Observations (Volume, Gann & CVD + ADX Focused)
a) Volume Profile Insights:
Value Area High (VAH): 19,979.00
Value Area Low (VAL): 19,845.22
Point of Control (POC):
Recent POC: 19,979.52
Prior POC: 19,845.22
High-volume nodes: Clearly seen around 19,845 and 19,880–19,980, indicating buyer-seller equilibrium.
Low-volume gaps: Between 19,900–19,950 and below 19,800–19,700 — price can move fast through these zones.
b) Liquidity Zones:
Stops Likely Clustered:
Above 20,000 (psychological + prior swing high)
Below 19,800 (swing low and zone of previous rejection)
Absorption Zones:
Notable delta-based absorption occurred around 19,845 and 19,880 zones, indicating institutional activity.
c) Volume-Based Swing Highs/Lows:
Swing High (with spike): 19,980–20,000 (strong volume + reversal candle).
Swing Low (with spike): 19,845 zone, also aligns with historical POC, confirming strong defense.
d) CVD + ADX Indicator Analysis:
Trend Direction: Range-bound to Bearish bias
ADX Strength:
ADX is hovering near 20, not confirming a strong trend.
DI- > DI+ suggests slight downward pressure.
CVD Confirmation:
Flat to slightly falling CVD with price stalling = Supply is outweighing demand, slight bearish bias.
2. Support & Resistance Levels
a) Volume-Based Levels:
Support:
19,845.22 (POC + VAL)
19,800 (swing low and absorption)
Resistance:
19,979.52 (POC)
20,000 (psychological + rejection zone)
b) Gann-Based Levels:
Confirmed Swing High: 20,000
Confirmed Swing Low: 19,845
Key Retracements (From 19,845 to 20,000):
1/2: 19,922
1/3: 19,896
2/3: 19,969
3. Chart Patterns & Market Structure
a) Trend: Range-bound to Slightly Bearish
Price is stuck between 19,845–19,979 with no clear breakout or breakdown.
b) Notable Patterns:
Horizontal consolidation forming after a failed breakout near 20,000.
Bearish bias is developing with failure to hold above POC.
Watch for breakout from the descending triangle setup forming.
4. Trade Setup & Risk Management
a) Bullish Entry (Only if breakout above resistance):
Entry Zone: 19,985–20,000 (break + retest)
Targets:
T1: 20,100
T2: 20,300
Stop-Loss (SL): 19,940 (below breakout level)
RR: Minimum 1:2
b) Bearish Entry (If CVD + ADX confirm downtrend):
Entry Zone: 19,845–19,860 (retest of support failure)
Target:
T1: 19,700
Stop-Loss (SL): 19,980
RR: Minimum 1:2
c) Position Sizing: Risk 1–2% of capital per trade.

NQ: Prior to the FEDAs expected, NQ is consolidating.
Tomorrow is a big day in terms of looking forward. What should we expect from the FED?
1- FED Mandate is: Employment and Inflation
2- FED has always said: FED policy is data related.
The latest data on both Employment and Inflation were not sufficiently bad to rationalize the rate cuts and feed Trump's pressure.
Hence, I think the FED won't give any hint tomorrow about the rate cut on June. This will disappoint market and a Sell-off of stocks and equities will be massive. The start of Wave 3.
The other scenario will send stocks and equities up in a zigzag move: Down then up.
Gold as a lead indicator has resumed up its direction. This might be a sign of what is coming for equities.
Have a good evening/night!

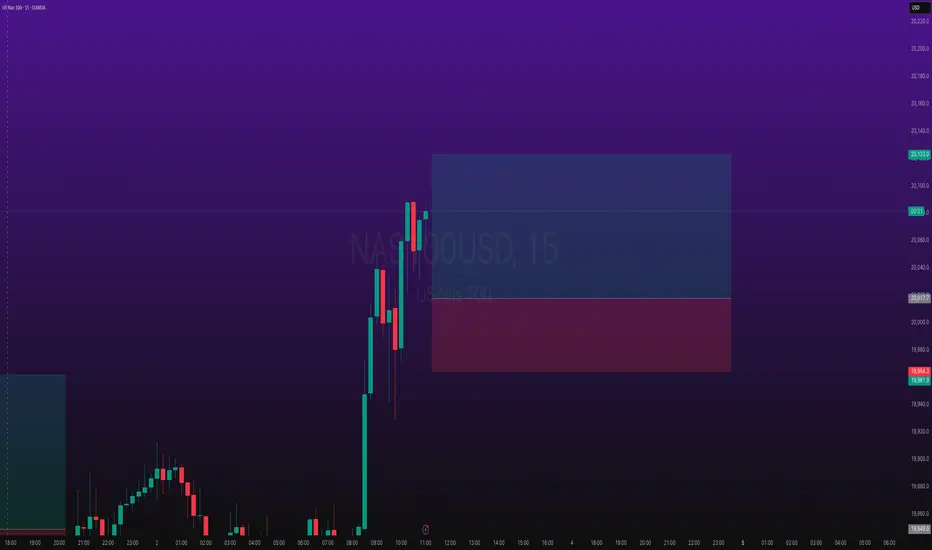
NAS - SLOWLY enter the long positionTeam, NAS time to buy slowly
We been waiting for the last two day
as we expect market will drop before RATE announcement
this is a good entry but buy slowly
if it drop to second box, double up.. the volume
Trade with confident.

NQ: Consolidation phaseWhile market is waiting for a clear hint from the FED or a concluded deals on tariffs, NQ has entered in a consolidation phase.

NAS100 1-8RR LONG Trade ideia.NAS100 1-8RR LONG Trade ideia. Once we see the brake of structure in 5min we can buy and hold for 1-8RR. Still the same setup I shared ealier.

Supply and demandA rally base drop... Market rally up and created a zone and drop breaking the previous structure creating a near perfect setup which has a zone that has not been tested and is aligned with higher time frame so market will drop when it gets to that zone

My NQ Long Idea 5/5/2025Been a while but I haven't been posting ideas because I have been scalping and doing smaller time frame trades. I think we have NQ at a nice price level where we might see a bull run soon with the market sentiment slowly "thawing" on the idea of "risk-off" sentiment to "risk-on" sentiment and environment with more uncertainties clearing out of the market scenes.
We have US trying to negotiate deals with many countries including China which is very challenging and we can never know if it will be achieved or not. However, from an economic point of view we can agree that the US economy is in the Neutral-bullish. We have a very bullish price action in the past week or so. We also have healthy economic numbers but it is still unclear until Wednesday.
On Wednesday the FED will speak on this matter and give us some clarity on whether it is a Risk-on or Risk-off environment. Anything will happen but I can see the "Gap" getting filled on FED day due to the SPIKE that will be delivered to us.
Currently Edgefinder tool is giving us 8 for NQ with only the GDP and sPMI scores in the negative. However the net score is bullish and on the positive.
I think 1 of those two ideas will be played out sooner or later anything can happen but from a technical view I would like to see the price reaching the 50% FIB and then take off from there.
It is subjective though and everything in trading is subjective including what I do and say.

NAS100 and the analysis that has reached a conclusion and has noToday I was reviewing my previous analyses when I came across this chart on NAS100 and after months of waiting, it had come to fruition.
It's a bit late to publish now, but I will gradually increase the number of symbols and arrange the time so that the results are available to everyone on time!!
Good luck!
MJ.REZAEI

NAS100 Rejected at Key Supply Zone | Pullback in Play?The NASDAQ 100 (NAS100) just tapped into a strong supply zone around 20,000 – 20,100 and is showing signs of rejection. Price is currently at 20,007, down -0.45%, and struggling to hold above the demand turned resistance.
Chart Highlights:
Supply Zone: 20,000 – 20,100 (visible rejection area).
Key Support Levels:
19,852 – immediate structure level.
18,846 – breakout origin, potential demand zone.
17,673 – major volume and demand cluster (orange zone).
Bearish Bias:
If price loses 19,852, we could see a drop toward 18,846.
Failure there opens the path for a deeper correction to 17,673, where buyers are likely to step in.
Bullish Trigger:
A clean break and close above 20,100 would flip the script and suggest continuation of the bullish rally.
Volatility Warning:
Upcoming U.S. economic data could cause sharp moves (see calendar icon on chart). Be cautious and reactive.
Trade Setup: Watch for short opportunities below 19,852 with stops above supply and targets near the marked supports.
---
Is NAS100 gearing up for a dip or breaking out soon? Drop your forecast in the comments!
#NAS100 #NASDAQ #TechnicalAnalysis #SupplyAndDemand #VolumeProfile #LuxAlgo #PriceAction #IndicesTrading #USMarket #ForexSignals #SmartMoney

Technical Breakdown on US 100 | 1H TimeframeTechnical Breakdown on US100 1H Chart using Volume Profile, Gann, and CVD + ADX
1. Key Observations (Volume, Gann & CVD + ADX Focused)
a) Volume Profile Insights:
Value Area High (VAH): 20,035 (approx. from most recent high-volume node)
Value Area Low (VAL): 19,710
Point of Control (POC):
High-Volume Nodes: Clustered between 19,850 – 20,050 (heavy volume activity)
Low-Volume Gaps: Between 19,700 – 19,800 (could act as fast move zones)
b) Liquidity Zones:
Liquidity Pools:
Order Absorption: Observed near 19,850 (buy side absorption with wicks and CVD reaction)
c) Volume-Based Swing Highs/Lows:
Swing High: 20,035 with volume tapering and price exhaustion
Swing Low: 19,710 showing high delta rebound and large wick
d) CVD + ADX Indicator Analysis:
Trend Direction: Uptrend (price making HH/HL, supported by rising channel)
ADX Strength: ADX > 20, DI+ > DI- → Confirmed bullish trend
CVD Confirmation:
2. Support & Resistance Levels
a) Volume-Based Levels:
Support:
Resistance:
b) Gann-Based Levels:
Recent Swing Low: 19,710 (1/3 retracement zone)
Key Retracement Levels:
3. Chart Patterns & Market Structure
a) Trend: Bullish (confirmed by ADX > 20 and CVD rising)
b) Notable Patterns:
Bullish Ascending Channel clearly forming with higher lows
Price pulled back to mid-channel + POC confluence, showing signs of retest and continuation
No major bearish reversal patterns yet; healthy pullback structure
4. Trade Setup & Risk Management
a) Bullish Entry (CVD + ADX confirm uptrend):
Entry Zone: 19,850–19,875 (POC retest + trendline support)
Targets:
Stop-Loss (SL): 19,700 (below VAL and swing low)
RR: ~1:2.5
b) Bearish Entry (Only on breakdown):
Entry Zone: Below 19,700 (VAL loss + CVD breakdown)
Target: T1: 19,422.18 (previous POC support)
Stop-Loss (SL): 19,860 (back above trendline/POC)
RR: ~1:2
c) Position Sizing:
Risk only 1-2% of capital per trade for controlled exposure

Nas100 Buy Looking at the w1 chart we can spot out a strong pullback momentum which gave D1 TF a bullish bias and now on h4 price look to pullback towards an AOI for a bullish continuation. Fingers crossed

NASDAQ SELL?This is just a rough idea, I still need to wait and see where the market moves to and rejects from in order for TP and SL placement.
But, there is a Asian high, a London high and a NY high sitting closely together, causing what I call a liquidity pool, and we all know that liquidity moves the market. its like a magnet for the market.
so I'll be waiting and watching to see which session is swept and how the market reacts. But all in all, this is what i personally think Nasdaq will do
what are your thoughts? I would love to hear them.
I hope you all have a fantastic week and you rake in those profits.
God bless
J.D.L

NQ: Upcoming Weekly Analysis!FA Analysis:
1- Macro economic Indicators: Most data came red and few were inline confirming the slowing down of the economy.
2- Inflation data came better than expected.
3- Trump Tariffs: Strong rumors about deals underway from this week. The 90-day pause will become an indeterminate pause.
4- We have the FED this week. Nothing in terms of immediate rate cut, but the conference is very important for the looking forward.
5-ISM Services data is important.
From FA perspective, market is focusing on Tariffs deals. If it materializes, the ST outlook will change from Sell to Buy. MT and LT Outlook will stay Sell.
TA Analysis:
Weekly TF:
The weekly close was bullish and price retraced more than 61.8. This could be the end of this wave.
The FED and/or the tariff deals will give the signal for either the start of wave 3 or a continuation up. Until then, a consolidation is expected.
Daily TF:
Same as weekly... a bullish daily close. A consolidation is expected until the FED.
Happy and green week to Everyone!

US100 BEST PLACE TO SELL FROM|SHORT
US100 SIGNAL
Trade Direction: short
Entry Level: 20,101.6
Target Level: 18,779.9
Stop Loss: 20,975.6
RISK PROFILE
Risk level: medium
Suggested risk: 1%
Timeframe: 12h
Disclosure: I am part of Trade Nation's Influencer program and receive a monthly fee for using their TradingView charts in my analysis.
✅LIKE AND COMMENT MY IDEAS✅

NAS100 1WTake a look at this chart! After a solid uptrend, the price broke an important ascending trendline and corrected down to the 0.5 Fibonacci level — right where a key structural support zone is (that blue area near the bottom).
From there, we’ve seen a strong bounce back upward, and now the price has reached a critical zone:
Previous resistance
The 0.618 to 0.786 Fibonacci retracement area
And most importantly, a retest (pullback) to the broken trendline
There are two possible scenarios ahead:
1. If the price breaks and holds above this resistance zone, we might see the continuation of the bullish move.
2. But if it fails to break through, the market could enter another corrective phase.
Also, keep in mind that we have the interest rate decision this week. With Trump applying repeated pressure, there’s a chance rates might be cut — which could fuel a green, bullish market.

X2: NQ/US100/NAS100 Long - Day Trades 1:2X2:
Risking 1% to make 2%
NAS100, US100, NQ, NASDAQ Long for day trade, with my back testing of this strategy, it hits multiple possible take profits, manage your position accordingly.
Risking 1% to make 2%
Use proper risk management
Looks like good trade.
Lets monitor.
Use proper risk management.
Disclaimer: only idea, not advice
Nasdaq LongsShould price retrace to that IFVG level, I will look for a sell side liquidity sweep and go long.

NASDAQ Sell idea🔸 Resistance Strong supply zone around 19,419.5–19,430 (previous high & breakout failure)
🔸 Bearish Structure If price fails to break and hold above 19,430, double top or lower high forms
🔸 Wick Rejection Multiple upper wicks near resistance could signal rejection and exhaustion
🔸 Volume Behavior Potential volume spike without follow-through → trap buyers
🔸 Momentum Divergence If momentum slows on retest of high, weakening bullish pressure


X2: NQ/US100/NAS100 Long - Day Trades 1:2X2:
Risking 1% to make 2%
NAS100, US100, NQ, NASDAQ Long for day trade, with my back testing of this strategy, it hits multiple possible take profits, manage your position accordingly.
Risking 1% to make 2%
Use proper risk management
Looks like good trade.
Lets monitor.
Use proper risk management.
Disclaimer: only idea, not advice

LONG IDEA LASCENDING CHANNEL BREAKOUT NAS100?Looking for a breakout of this upward channel, price above EMA, targeting 27.20 fib level or most recent high before downward trend began.
Opinions?

anyone that is buying is missing outgreat discounts I guess sir Warren Buffet is to buy now? still this good discounts are for everyone to buy.
