Recovery or Pain?Will this be the infliction point or breaking point? Here we have multiple points of importance. Will this be a bounce or a crash?
SPX trade ideas

S&P 500 Crash Idea / Opportunity Cumulation PeriodIf we are lucky, there will be three levels and three opportunities. I am also waiting to see if this really happens and we see a market crash and the SPY go down about 35-40% from its all-time high. We were heavily getting the Tesla options one year prior.

+10% from tomorrow till mid-MaySPX is getting ready to rebound with around 10% till mid-May. Invalidated if breaks below 5400.

Your daily DON'T PANIC reminderHi fellow traders.
This is your daily reminder not to panic. STICK to your strategy.
We're on the elevator down, but WE WILL climb the stairs back up. zoom out on an S&P or Nasdaq chart. STONKS GO UP. It hurts now, but this is also the time to accumulate stocks you have always wanted.
Look for the levels. Don't panic. STICK TO YOUR STRATEGY!

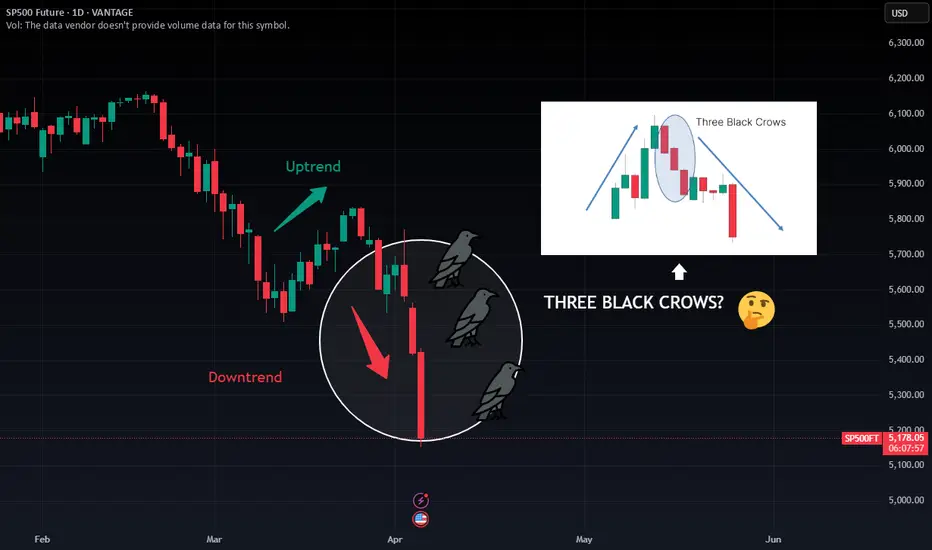
Are These the Three Black Crows Signaling More Pain Ahead? The S&P 500 has just printed three consecutive long-bodied red candles following a brief uptrend. This classic "Three Black Crows" formation could be a powerful bearish reversal signal—one that historically hints at a deeper correction on the horizon.
📊 What does this pattern mean?
Appears after an uptrend or rally.
Consists of 3 bearish candles closing near their lows.
Suggests strong seller control and trend reversal potential.
🔍 Current context:
The S&P is already under heavy pressure from macroeconomic and geopolitical concerns.
This pattern adds further bearish sentiment, especially if we see continued follow-through on volume.
🚨 If confirmed, we could be looking at the continuation of a larger downtrend. But remember: confirmation is key. Watch closely how price reacts in the next 1–2 sessions.
🧠 Do you see this as a real warning—or just a pause before the next leg up?
#SP500 #ThreeBlackCrows #CandlestickPatterns #BearishSignal #TechnicalAnalysis

Big Bear Leg Coming if this is ABC This looks like it might be a big corrective ABC leg inside of a downtrend. While markets have had a very bullish tone to them recently we've not really bounced that much and the daily trend is still down on big swings.
Perhaps the corrective period is over and new bear waves are forming. If so, this should be about the high of them here.

S&P 500 Faces Increased Bearish Pressure as Trade War BeginsThe S&P 500 has formed a downtrend channel following the break below the 5700 support level. Trump's new aggressive tariff policy raised the minimum tariff on China to 54%, while China responded with equally aggressive 34% tariffs. The trade war has now officially begun.
This escalation is clearly negative for the stock market. Recession risks have risen significantly, and it remains uncertain how much the Fed can cut rates while tariff-driven inflationary pressures persist. Rapid rate cuts could help soften the slowdown but may also risk fueling another inflation surge. That would be the more optimistic case for equities. However, the Fed is likely to proceed cautiously, suggesting that bearish pressure could continue for several quarters.
In the short term, the downward trend remains intact. If the S&P 500 breaks the 38.2% Fibonacci retracement level, it may decline further toward the lower boundary of the new trend channel, where a potential bounce could occur. As long as the trend holds, bears remain in control.
Note: Powell is expected to speak today. His remarks carry even more weight following the tariff moves by both the U.S. and China.

Hank Tough - Long ride down to 4,514 for US500Even with better than expect numbers with NFP.
The matter remains that the world is not on great terms with MAGAs Tariff plan. Tariffs are in an indirect way a threat when it comes to trade wars.
Because, there'll need to be reciprocals and larger measures to make up for the mess.
Apparently, the calculations of the tariffs was to make up for the trade deficit, but it means that there'll need to ACTUALLY be the same amount or more of exports - which we know won't happen as there are two types of goods.
Elastic - Where the price and demand and supply changes.
Inelastic - where they a don't change much.
Right now there is a LARGE Inverse Cup and Handle forming on the daily with the price below 20 and 200 - showing strong downside to come.
So, we can expect looking at the pattern to continue to 4,514.
'Disclosure: I am part of Trade Nation's Influencer program and receive a monthly fee for using their TradingView charts in my analysis.
Thoughts?

SPX 10% in 48hrsSometimes a good trade is no trade in itself. That being said.
Historically RARE we don't get a relief rally but we need the fed.
The market will look for the Fed to provide answers.
+
Fear and Greed index
Technicals oversold
VIX
Money rotation showing signs of a turn.
XLY/XLP at the back end of January shows weakening of the US consumer.

Trump single handedly started a worldwide recession- of course, economic recessions and a stock market correction/crash are two very different things but in this case it does seem like both are probably connected seeing tariff implementations against basically the entire world are hardly productive in an economic sense
- with March´s close, the 3M candle closed as a BEARISH engulfing
- SPX to fall at least to the 600 level but even a scenario such as a year to two year long bear market should not be excluded
In addition, there is a REAL RISK of China expediting its process of unification with Taiwan and could use the overall macro uncertainty as a veil under which it may attack the island sooner rather than in 2027 or 2028.

S&P500 down -4.84%, worst day since 2020 COVID crash! GAME OVER?The S&P500 (SPX) had yesterday its worst 1D closing (-4.84%) in exactly 5 years since the COVID flash crash started on March 11 2020 (-4.89%). Not even during the 2022 Inflation Crisis did the index post such strong losses in a day.
Obviously amidst the market panic, the question inside everyone's minds is this: 'Are we in a Bear Market?'. The only way to view this is by looking at SPX's historic price action and on this analysis we are doing so by examining the price action on he 1W time-frame since the 2008 Housing Crisis.
As you can see, starting from the Inflation Crisis bottom in March 2009, we've had 4 major market corrections (excluding the March 2020 COVID flash crash which was a Black Swan event). All of them made contact with the 1W MA200 (orange trend-line) and immediately rebounded to start a new Bull Cycle. Those Bull Cycles typically lasted for around 3 years and peaked at (or a little after) the red vertical lines, which is the distance measured from the October 15 2007 High to the May 07 2011 High, the first two Cycle Highs of the dataset that we use as the basis to time the Cycles on this model.
The Sine Waves (dotted) are used to illustrate the Cycle Tops (not bottoms), so are the Time Cycles (dashed). This helps at giving a sense of the whole Cycle trend and more importantly when the time to sell may be coming ahead of a potential Cycle Top.
This model shows that the earliest that the current Cycle should peak is the week of August 11 2025. If it comes a little later (as with the cases of October 01 2018 and June 01 2015), then it could be within November - December 2025.
The shortest correction to the 1W MA200 has been in 2011, which only lasted 22 weeks (154 days). The longest is the whole 2008 Housing Crisis (73 weeks, 511 days). All other three 1W MA200 corrections have lasted for less than a year.
On another note, the 1W RSI just hit the 34.50 level. Since the 2009 bottom, the market has only hit that level 5 times. All produces immediate sharp rebounds. The December 17 2018, March 16 2020 and August 15 2011 RSI tests have been bottoms while May 09 2022 and August 24 2015 bottomed later but still produced sharp bear market rallies before the eventual bottom.
Uncertainty is obviously high but these are the facts and the hard technical data. Game over for stocks or this is a wonderful long-term buy opportunity? The conclusions are yours.
-------------------------------------------------------------------------------
** Please LIKE 👍, FOLLOW ✅, SHARE 🙌 and COMMENT ✍ if you enjoy this idea! Also share your ideas and charts in the comments section below! This is best way to keep it relevant, support us, keep the content here free and allow the idea to reach as many people as possible. **
-------------------------------------------------------------------------------
💸💸💸💸💸💸
👇 👇 👇 👇 👇 👇

No Bottom in the S&P 500 Yet!Unsurprisingly, the Cboe Volatility Index (VIX Index) – one of the most popular measures of US stock market volatility – recently shook hands with 30.00, levels not seen since August 2024. As a result, I am closely monitoring the daily charts of the VIX (with standard Bollinger Bands overlaid) and the S&P 500.
As shown on the charts, the VIX closed above the upper Bollinger Band, signalling that sentiment could be overstretched and may revert to the mean. Consequently, as on many occasions in the past, this suggests that S&P 500 bulls may attempt to step in. However, chart studies reveal support is not evident until 5,190, which happens to be joined by a 100% projection ratio at 5,152 (an equal AB=CD support pattern). Interestingly, this indicates that further underperformance and higher VIX levels could be on the table before we see signs of a reversal.
Written by FP Markets Chief Market Analyst Aaron Hill


Are Time and Reason in Harmony in SPX?Are Time and Reason in Harmony in SPX?
S&P 1D Technical and Fundamental Analysis;
This structure, which looks like an ordinary decline on the SPX daily chart ... in fact, we can say that it carries the pieces of a big scenario that develops synchronously both technically and fundamentally.
Let me explain now;
5 December 2024 was not just a breaking point. Because Trump's statements after taking the presidency for the second time, especially the message that ‘customs walls may rise’ had become clear.
In the same week, the uptrend in SPX quickly weakened and declined as the FED gave the message ‘Interest rate cut is not imminent’.
From here, Bullish Sharq started the formation of harmonic formation.
Now comes the week of 1 May.
- FED's interest rate decision,
- Trump's budget plan,
- And one of the critical macro thresholds where company balance sheets are announced.
While everything is going well so far, if we take into account that the chart will also touch a strong trend line, it may mean ‘either a bounce or a collapse from here’.
Because the price in the market does not just move, it looks for reasons .
I would also like to ask you here;
What will greet the market when this date comes?
Harsh interest rate rhetoric?
Trump's aggressive economic agenda?
Or a recovery supported by positive balance sheets?

S&P 500 resistance levels#SPX
Upon observing the 6-month cash data of the S&P index, it becomes clear that this index has reached significant resistance levels. However, it is still too early to proclaim the beginning of a major correction in this index. That said, it can be anticipated that a potential price correction might extend to the range of 4800 to 4500.
When comparing the wave count of this index with the Warren Buffett Indicator, both reveal a common message: the S&P is currently situated in sensitive zones.
There are two critical price ranges for this index that could lead to significant price reversals: the first range is between 6085 and 6240, and the second range is between 7900 and 8000.

TrumpFall in the Market due to Reciprocal Tariffs.By Ion Jauregui - Analyst ActivTrades
The announcement of new reciprocal tariffs by President Donald Trump has triggered an immediate reaction in the markets, causing dizzying drops in various companies since the beginning of the week. The measure has generated an environment of high volatility, with investors seeking refuge in the face of growing instability.
Most Affected Companies and Sectors
- Technology and Semiconductors
• Apple Inc. has seen its shares fall by more than 15% during the week, affected by its dependence on global supply chains.
• Amazon and Meta: Both tech giants have seen declines of about 9%, driven by fears over international exposure and rising tariff costs.
• Nvidia and other companies in the semiconductor sector: They have posted even larger declines, reflecting this sector's sensitivity to trade uncertainty.
- Automotive and Aerospace
• Tesla Inc.: The electric vehicle maker has plunged nearly 20%, driven by concerns about rising production costs and competition from local manufacturing.
• Boeing Co: Shares have fallen around 18% on concerns about potential disruptions to its supply chain and the impact of new trade barriers.
- Industrials and Conglomerates
• General Electric: The conglomerate has seen its share price fall by around 16%, as its extensive global operations are threatened by the tightening of trade policies.
- Transportation & Logistics
• AP Moller Maersk and Hapag-Lloyd: The shipping companies have suffered sharp declines, reflecting the sector's sensitivity to global trade dynamics and tariff measures.
- Energy
• Chevron and TotalEnergies: Oil prices have fallen by 5% following the unexpected increase in supply by OPEC+, causing significant losses for these oil companies, which are facing an environment of uncertainty and adjustments in the energy markets.
- Financial Sector
• Asian Banks: Although no specific names are mentioned, several banks in Asia have experienced pronounced volatility, being affected by the environment of uncertainty and concerns about asset quality in the region.
• Small cap indices: The Russell 2000, which groups smaller U.S. companies, has fallen 6.6% and accumulated a loss of over 20% since its record high in November, also reflecting the sensitivity of the financial sector in the current environment.
S&P500 Analysis
Looking at the one hour chart we can see that since April 2nd, a lower bell curve has already started, despite the fact that the Price Control Point (POC) is located in the area where it was trading in the early hours of yesterday's Asian trading day at around 5624 points.
This fall related to the news has caused the markets to discount the price by -6.84% and around 2.34% at yesterday's American opening. As soon as the U.S. session began, the conditions were in place again to continue the fall that seemed to have slowed down during the European day, but it was only a bearish consolidation. At this moment, the US premarket seems to have stopped the fall that generated a third bell in the Asian session.
Checking the RSI, it has moved from 70% on Wednesday at 18:00 to 23% in today's Asian session. So it could be that today's day will not be as black as yesterday's, but for the moment the bearish mid-range crossover started on Wednesday has only expanded. As for the average volume on both day 2 and 3 the volume has been similar to the openings of other days, so in this sense it is not something that can reveal additional information but only represents that this fall is the result of the “power of fear of tariffs in the market”.
A Global Landscape of Uncertainty
Trump's announcement has generated a ripple effect in international markets. In the United States, investors are skeptical about the economy's ability to withstand these shocks, which has prompted a search for refuge in assets considered safer, such as Treasury bonds and defensive sectors (consumer staples, healthcare, telecommunications and utilities).
Uncertainty is spreading globally: the Nasdaq has fallen by 5.4% and the Nasdaq 100 has lost 17% of its value since its peak in February. In international markets, indices such as the Nikkei 225 and the TOPIX in Japan have registered declines of 3.3% and 4.2% respectively, demonstrating the global scope of the instability.
*******************************************************************************************
The information provided does not constitute investment research. The material has not been prepared in accordance with the legal requirements designed to promote the independence of investment research and such should be considered a marketing communication.
All information has been prepared by ActivTrades ("AT"). The information does not contain a record of AT's prices, or an offer of or solicitation for a transaction in any financial instrument. No representation or warranty is given as to the accuracy or completeness of this information.
Any material provided does not have regard to the specific investment objective and financial situation of any person who may receive it. Past performance is not reliable indicator of future performance. AT provides an execution-only service. Consequently, any person acing on the information provided does so at their own risk.

SPX 500SPX is looking bearish also. We will soon see major decline given the targets as shown in analysis.
Stay Safe!
Sharing your Analysis down below will help us understand financial markets better...
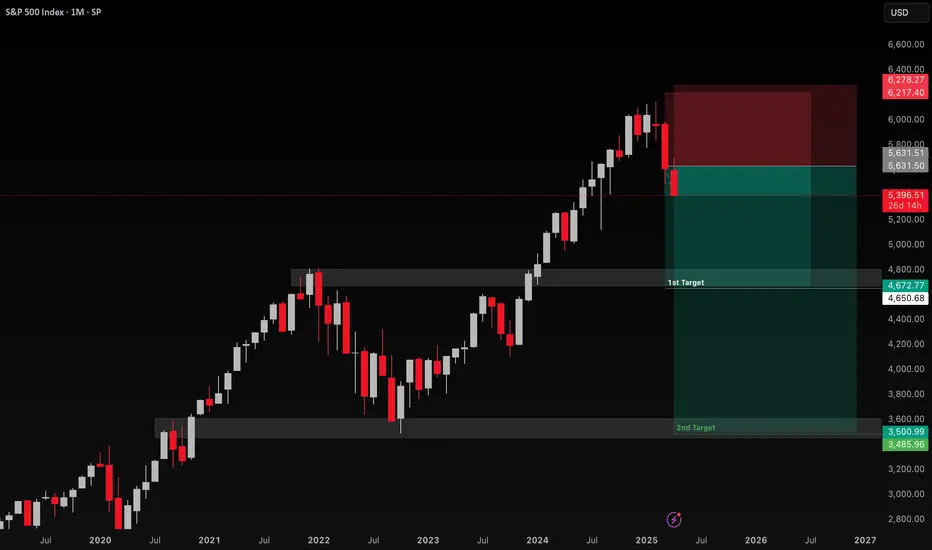
Head & Shoulder Breakdown: Will S&P 500 Drop Another 10%?● The S&P 500 has experienced significant volatility recently, mainly due to President Donald Trump's announcement of new tariffs.
● On April 3, 2025, the index saw a nearly 5% drop, its worst single-day loss in five years.
● The recent price action suggests that the index has broken below the neckline of the Head and Shoulder pattern, indicating a potential continuation of the downward trend.
◉ Key support levels to watch
● 1st Support - 5,200 - 5,250
● 2nd Support - 4,950 - 5,000

Bullish Divergence and the Impact of Trump’s TariffsOn the daily chart of the S&P 500, I’m currently spotting a clear bullish divergence. This type of divergence is a technical pattern that suggests that, despite recent price drops, the downtrend is losing momentum and a potential upward move could be on the horizon. It shows that the index has underlying strength, which the price hasn’t fully reflected yet — making a bullish reversal very likely in the short to mid-term.
In this context, the recent drop in the S&P 500 has been largely driven by Donald Trump’s tariff announcements, especially targeting China and other countries. However, based on my analysis, I believe that these tariffs were more of a negotiation tactic than a long-term economic strategy. And now that things are clearly not going as expected, I’m convinced that Trump will be forced to scale back the tariffs or start accepting less favorable trade agreements just to stop the bleeding — because I highly doubt he will allow this sharp market decline to continue unchecked.
Why tariffs aren’t coherent or beneficial for the global economy
Tariffs are additional taxes on imports. Although they’re often marketed as a way to protect local industries, in reality, they increase prices for consumers and destabilize global supply chains. The result is damaging for both the countries imposing the tariffs and those receiving them. In the case of the U.S., despite Trump’s promises, these tariffs are actually hurting American companies that rely on imported materials and products, leading to higher internal costs and squeezing consumers.
Worse yet, this ongoing trade war has created a climate of global economic uncertainty, which is driving down investment and confidence. That uncertainty has translated into market selloffs around the world, and the S&P 500’s current decline is a direct reflection of that. Importantly, it’s U.S. businesses — not foreign governments — who are absorbing the cost of these tariffs.
What to expect going forward
Despite the pressure from tariffs, I believe that Trump — seeing the damage already being done to the markets — will have no choice but to start dialing things back. My take is that to avoid a deeper economic hit and restore investor confidence, the U.S. will likely pursue more balanced deals, even if it means compromising a bit.
If this scenario plays out, I expect the S&P 500 to begin recovering, especially as investor uncertainty fades. The bullish divergence on the chart further reinforces the idea that once these external political and economic pressures ease, the market could see a strong and sharp rebound.
Conclusion
Trump’s tariffs were intended as leverage — but they’re clearly backfiring and doing more harm than good. The current S&P 500 correction, in my opinion, is actually a buying opportunity for those with a long-term view. With potential tariff reductions and fairer trade deals on the horizon, the market is likely to rebound strongly, especially with the bullish divergence we’re seeing on the charts.
Markets may have already priced in the worst, and now we’re seeing the first technical signals of a potential turnaround. If confirmed, the price could begin to rally significantly in the coming days or weeks.

SPX: When things get scary, get ready!Wave C of 4 is ongoing and quite emotional. Wave B didn't quite get high enough, so chance of a larger C wave is high. This could last for a few days to a few months depending on how long this trade shenanigans continue. But, ultimately I don't think this will be a permanent situation and once things settle, markets will recover strongly. The underlying economic strength is still intact and there is still a lot of money in the system. If the Fed does start to cut the interest rates, it will initially boost the stock market but will weaken the economic conditions significantly. That might play out the final blow off top narrative perfectly. But for now, plan is to start nibbling on SPY when SPX gets inside the box. Some kind of butterfly strategy to limit the downside risk would be the play. Below 4100 will be the time to really panic!

THERE IS NO SECOND BEST!!!!!Isn't 7,173,313,985.56% enough to make this clear?
Strong confidence for a new ATH later this year.
Man, always good to recall what is the best performing asset ever.

This is just the appetizerIf you think a 4% drop is the end, think again. Save your cash unless you want to short the market. We haven’t seen real action such as a market halt or two before it is time to think about putting cash into action. Be warned
