SPX: trade should not be a weaponPositive sentiment continued on the US equity markets during the previous week, after stronger than expected US jobs data. The Non-farm payrolls posted on Friday reached 177K in April, which was significantly above the 130K expected by the market. The market estimate was significantly lower from March data, as analysts were expecting to see a spill over effect of the imposed trade tariffs. As the jobs market seems still quite strong, the positive market sentiment was intact during the week. However, the recession fears are still holding among investors. The S&P 500 continued its 9-days winning streak, ending the week at the level of 5.686.
On a positive side was the news that Chinese authorities are considering starting negotiations with the US Administration regarding trade tariffs. This was another positive boost for investors' sentiment. Berkshire Hathaway was holding shareholders annual meeting on Saturday, where the most attention of both media and investors was on the speech of its founder and famous investor, Warren Buffet. In his address to the shareholders, Buffet strongly criticized the trade tariffs, noting “Trade tariffs are an act of war … trade should not be a weapon’.
For the moment, it could be expected that the positive sentiment might continue also in the future period. However, the FOMC meeting and Fed rate decision is scheduled for Wednesday, May 7th. This could be a day of higher volatility, as Fed Chair Powell will address the public at the press conference after the meeting. The markets will closely watch what he has to say regarding the current state of the US economy and potential rate cuts during the course of this year.
SPX500 trade ideas

SP500 Ready to RetraceS&P doesn't look good for next week. Probably a gap up to get rid off shorts then drop.

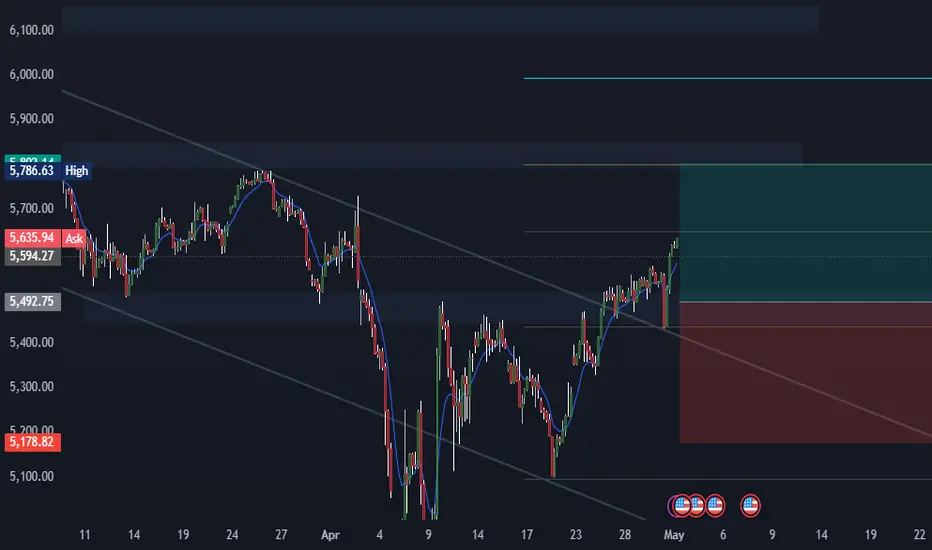
SPX500 H4 | Potential bullish bounceSPX500 could fall towards an overlap support and potentially bounce off this level to climb higher.
Buy entry is at 5,546.94 which is an overlap support.
Stop loss is at 5,440.00 which is a level that lies underneath an overlap support.
Take profit is at 5,789.71 which is a swing-high resistance.
High Risk Investment Warning
Trading Forex/CFDs on margin carries a high level of risk and may not be suitable for all investors. Leverage can work against you.
Stratos Markets Limited (tradu.com):
CFDs are complex instruments and come with a high risk of losing money rapidly due to leverage. 63% of retail investor accounts lose money when trading CFDs with this provider. You should consider whether you understand how CFDs work and whether you can afford to take the high risk of losing your money.
Stratos Europe Ltd (tradu.com):
CFDs are complex instruments and come with a high risk of losing money rapidly due to leverage. 63% of retail investor accounts lose money when trading CFDs with this provider. You should consider whether you understand how CFDs work and whether you can afford to take the high risk of losing your money.
Stratos Global LLC (tradu.com):
Losses can exceed deposits.
Please be advised that the information presented on TradingView is provided to Tradu (‘Company’, ‘we’) by a third-party provider (‘TFA Global Pte Ltd’). Please be reminded that you are solely responsible for the trading decisions on your account. There is a very high degree of risk involved in trading. Any information and/or content is intended entirely for research, educational and informational purposes only and does not constitute investment or consultation advice or investment strategy. The information is not tailored to the investment needs of any specific person and therefore does not involve a consideration of any of the investment objectives, financial situation or needs of any viewer that may receive it. Kindly also note that past performance is not a reliable indicator of future results. Actual results may differ materially from those anticipated in forward-looking or past performance statements. We assume no liability as to the accuracy or completeness of any of the information and/or content provided herein and the Company cannot be held responsible for any omission, mistake nor for any loss or damage including without limitation to any loss of profit which may arise from reliance on any information supplied by TFA Global Pte Ltd.
The speaker(s) is neither an employee, agent nor representative of Tradu and is therefore acting independently. The opinions given are their own, constitute general market commentary, and do not constitute the opinion or advice of Tradu or any form of personal or investment advice. Tradu neither endorses nor guarantees offerings of third-party speakers, nor is Tradu responsible for the content, veracity or opinions of third-party speakers, presenters or participants.

SPX long ideaBreakout of descending channel price retested and rejected most previous structure and aligns with 38. fib level on daily.
Targeting 27.2 level first.
Opinions?
US500 TRADE IDEAhi again
The US500 has shown strength by breaking the resistance at 5483.5 and is now at 5535. If the price reaches 5604.6 and a pullback occurs, targeting a temporary decline at the 50% Fibonacci retracement level is a good strategy.
Fibonacci retracement is often used to identify potential support and resistance levels where the price might pause or reverse. The 50% level is one of the commonly watched levels by traders as it often indicates a significant turning point in price movement.
good luck all
**My trading strategy is not intended to be a signal. It's a process of learning about market structure and sharpening my trading my skills also for my trade journal**
Thanks a lot for your support

Short Pullback Bigger RallySPX Daily Chart
SPX has made two island reversals and gapped up.
There are two resistances near 5500 and 5700. Some short pull backs in this region.
Thereafter, a rally up to the earlier high of 6200.

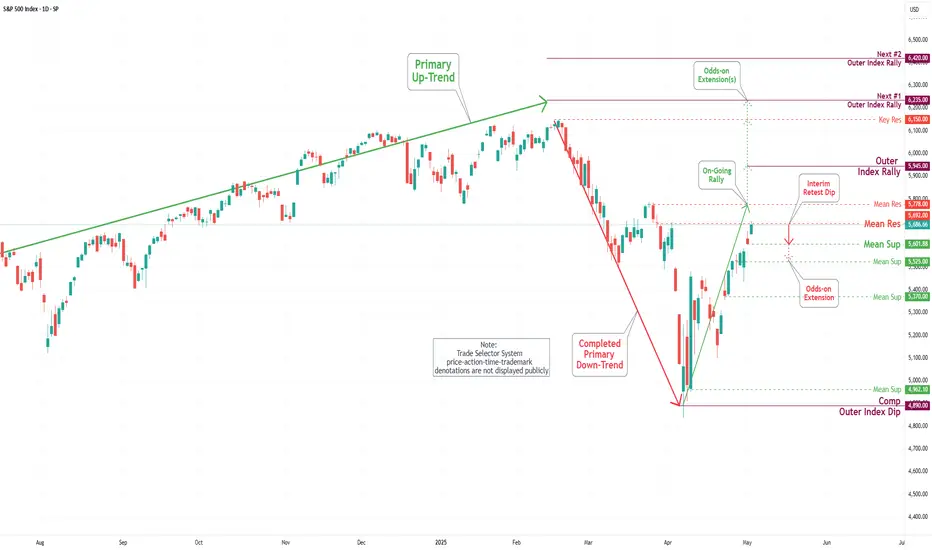
S&P 500 Daily Chart Analysis For Week of May 2, 2025Technical Analysis and Outlook:
During this week's trading session, the Index demonstrated a steady to higher price movement, achieving a key target at the Outer Index Rally level of 5550 and successfully surpassing the Mean Resistance level of 5672. This trajectory establishes the foundation for sustained upward momentum as it approaches the Mean Resistance level of 5778 and sets sights on reaching the next Outer Index Rally target marked at 5945. However, it is essential to acknowledge the substantial risk of a sharp retracement from the current price level to the Mean Support level of 5601, with the potential for further decline to the Mean Support level of 5525.
$SPX Resistance and Downward Momentum Resistance and Downward Momentum at the Top of the Gap, which is also the top of Friday’s Implied move.
I took 5645/5675 0dte bear call spreads, 1/4 width to start and so far so good.
Let’s see if we get the downward pull of todays trading range here.

SPX: Good push at EOD 4/30, but…Possible H&S? Hear me outGood push at end of day on 4/30 at close.
Zooming out, it’s starting look like it’s forming a H&S. I’m starting to see a lot of people flipping bearish as well. But, also near close today, volume was not promising, declining at the close.
I swung short-term puts on SPY, I like SPX puts for a day trade due to this formation but this H&S can possibly out within the end of week with more data and uncertainty or the following week.
I’m short at the touch of the light red line: 5655.79 to the downside.
Gaps below 5354.76, 5206.44
Would say by EOW to next week, if we pull back, may form/complete the right shoulder.
Do your DD!
Let me know your thoughts! #NFA

$SPX / $SP500 – China Deal or Global Meltdown? The Risk/Reward 📉 The S&P 500 ( SP:SPX / VANTAGE:SP500 / $ES_F) is at a geopolitical crossroads.
After the Global Pause, the index rebounded, but only to retest resistance near the 200-day EMA. Now it faces a binary outcome:
Scenario A: ✅ Deal with China
Estimated probability: 20%
Potential upside: +10%
Expected value: +2%
Scenario B: ❌ No Deal with China
Estimated probability: 80%
Potential downside: -50%
Expected value: -40%
📉 Expected move: -38% net Markets are not priced for this. Volatility ( TVC:VIX ) is quietly coiling under the surface (chart 2), ready to explode if the no-deal scenario materializes.

Weekend Trading Note - 3 May 2025A couple of interesting dynamics in the market over the latter half of the week:
- Minimal reaction to economic data suggests that traders are weighing the pull between deflation and tariffs, which are undoubtedly putting the fed in a bind. Can they raise rates at a time of uncertainty when it comes to tariff-induced inflation. Recent data suggests deflation and a strong economy. Nothing is clear.
- The temporary uncoupling of BTC and the Nasdaq100 is interesting, but such narrative-led decoupling has happened on a short-term basis before. Perhaps this time the anti-dollar trade will continue a while longer, until calm is restored.
- Businesses seem to be reacting to the Trump uncertainty by slowing down their trading activity and hesitating to invest or grow until more clarity is available. The loss of confidence and reassurance of clear direction may be damaging in the longer-term, elevating the potential for a technical recession as business enter more defensive posturing.
- Theres still some potential for good news around a deal between the US and China leading to a return to a risk-on regime in the near-term. The question on whether this will be enough to propel US equities to new all time highs will depend on the pre-existing structural issues with the macroeconomy
Enough macro. Here’s what I’m looking at in markets:
- SPX has retraced back up to the 0.618 fib of the recent downside move. This coincides with the POC on the anchored volume profile (anchored from the ATH). If the SPX is going to retest the lows, I’d expect it this begin in the next 5-10 days. A complete breakdown below its current lows is unlikely at this stage, but a wick slightly below current lows marking the bottom is definitely on the cards.
- BTC’s relative strength is encouraging. A retest of the $88700 level would offer a good entry for a trade back up to the current high at around $109K and perhaps more.

S&P 500 index Wave Analysis – 29 April 2025
- S&P 500 index broke key resistance level 5500.00
- Likely to rise to resistance level 5700.00
S&P 500 index recently broke the key resistance level 5500.00 (former support from March, which also stopped A-wave of the active ABC correction B from the start of April).
The breakout of the resistance level 5500.00 coincided with the breakout of the 50% Fibonacci correction of the downward impulse from February.
S&P 500 index can be expected to rise toward the next resistance level 5700.00, target price for the completion of the active impulse wave C.

S&P 500 correction before the global fall.S&P 500 correction before the global fall of the usa stock market.
Hey traders! I’m sure many of you have noticed that after the introduction of retaliatory tariffs, the markets started getting pretty choppy.
The S&P 500 took a serious dive.
• On the weekly chart, I’ve marked a support level + the 161.8% Fibonacci level, where we might see a bounce back to the $5680–$5800 range.
• But from there, I think we could see the start of a major crash—both in equities and crypto—that could last 1–2 years.
• Based on my estimates, the S&P 500 could drop back to 2020–2021 levels, a wide range of 2200–3000.
• For Bitcoin, we’re talking around $5000; for Ethereum, $100–$300; and for Solana, $2–$12.
3D Chart:
3W Chart:
Real-world events that could tank the stock market this hard:
Global Recession: If major economies (US, China, EU) slide into a recession at the same time—think trade wars, rampant inflation, or a debt crisis—investors will dump risky assets like hot potatoes.
Trade War Escalation: Harsher tariffs between the US and China/EU could wreck supply chains, crush corporate earnings, and spark a full-on market panic.
Geopolitical Conflict: A big blow-up—like a full-scale war or crisis (say, Taiwan or the Middle East)—could send capital fleeing to safe havens (gold, bonds), while stocks and crypto get slaughtered.
Collapse of a Major Financial Player: If a big bank or hedge fund goes bust (Lehman Brothers 2.0-style) due to an overheated market or bad debt, it could trigger a domino effect.
Energy Crisis: A spike in oil/gas prices (from sanctions or conflicts, for example) could kneecap the economy and drag risk assets down with it.
Market Bubble Burst: If the current rally turns out to be a massive bubble (and plenty of folks think it is), its pop could pull indexes down all on its own.
Looming Wars: A potential Russia-Europe war starting as early as 2025, or an Iran-Israel conflict that drags in multiple nations, could destabilize global markets, spike energy prices, and send investors running for the exits.

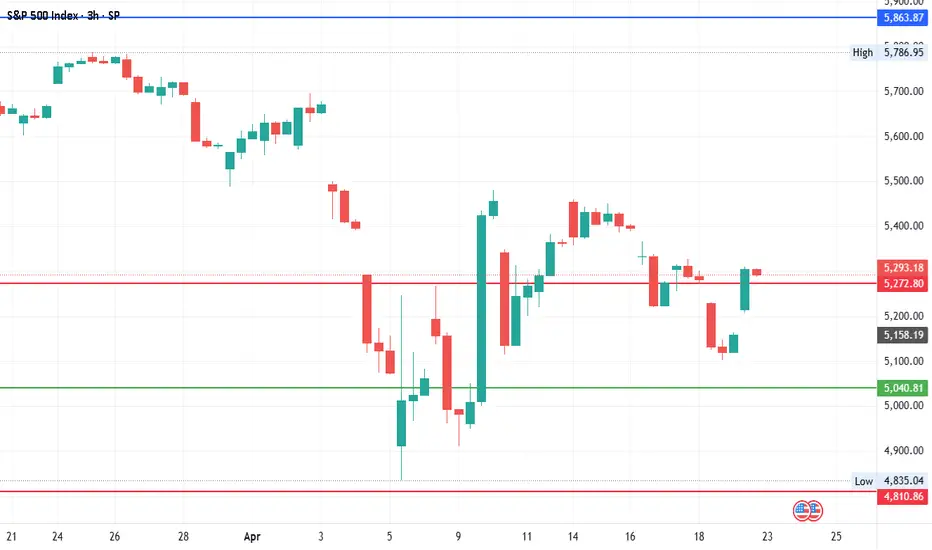
Bearish drop?S&P500 is reacting off the resistance level which is an overlap resistance and could drop from this level to our take profit.
Entry: 5,510.94
Why we like it:
There is an overlap resistance level.
Stop loss: 5,665.52
Why we like it:
There is a pullback resistance.
Take profit: 5,324.97
Why we like it:
There is an overlap support level that lines up with the 50% Fibonacci retracement.
Enjoying your TradingView experience? Review us!
Please be advised that the information presented on TradingView is provided to Vantage (‘Vantage Global Limited’, ‘we’) by a third-party provider (‘Everest Fortune Group’). Please be reminded that you are solely responsible for the trading decisions on your account. There is a very high degree of risk involved in trading. Any information and/or content is intended entirely for research, educational and informational purposes only and does not constitute investment or consultation advice or investment strategy. The information is not tailored to the investment needs of any specific person and therefore does not involve a consideration of any of the investment objectives, financial situation or needs of any viewer that may receive it. Kindly also note that past performance is not a reliable indicator of future results. Actual results may differ materially from those anticipated in forward-looking or past performance statements. We assume no liability as to the accuracy or completeness of any of the information and/or content provided herein and the Company cannot be held responsible for any omission, mistake nor for any loss or damage including without limitation to any loss of profit which may arise from reliance on any information supplied by Everest Fortune Group.

Is This a Massive AB=CD? I first joined this site under the "HoleyProfit" username in 2021 to give my warnings of potential bear markets. Obvious bear setups forming in the meme mania and I also though this would extend into the indices given a bit of time.
I was a bit early on the indices but over the following months all the tops were made and the drops came to pass.
Late 2022 I began to pivot back to bull when there was signs of bear trend failure and by early 2023 I was fully in the bull camp.
At the time I started to talk about a blow off top move. One which was exactly similar in size and style as the 2021 rally but the angle of the rally for a bit sharper.
This would have predicted a parabolic run to somewhere around 6000 - which has since come to pass.
Read the original post below.
If my thesis that we were heading into a giant D leg was correct, then that would mean we have a top made.
And we'd enter into super ugly market conditions over the coming months.

US Markets on the Edge – Heavy Bloodshed Ahead!The charts are screaming caution!
SPX, Nasdaq, and major tech stocks are showing clear signs of exhaustion. We could be entering a heavy correction phase.
This is not the time to be greedy — protect your capital, manage risk, and tighten those stop losses.
Stay alert. Stay smart.
Massive moves are coming, and not everyone will survive them.

SPX500: Short Setup Brewing!SPX500 is currently consolidating above the key volume node at 5,480.85, showing resilience after a sharp pullback last week. Price action remains inside a rising channel, but the steeper trendline has been broken, hinting at possible loss of momentum.
🔹 Key Observations:
Price is testing the lower trendline support—a breakdown here could trigger a move toward 5,400.
Volume profile shows heavy interest at 5,480, with a potential volume gap below that could accelerate downside.
VWAP support is intact for now, supporting a neutral-to-bullish bias.
A breakout above 5,530 would confirm bullish continuation and likely test 5,560+.
📈 Bias: Neutral to Bullish
📉 Breakdown Trigger: Below 5,480
📊 Probability Estimates:
Bullish breakout: 55%
Bearish breakdown: 45%
Watching closely for resolution at this inflection point. Patience until direction confirms.
💬 What’s your bias—bulls or bears?
#SPX500 #ES1 #S&P500 #VolumeProfile #TechnicalAnalysis #FOMC #VWAP #TrendlineBreak

S & P Index - Volatality Magic StudyThis is for the study purpose based on the index volatility and the level are based on no of points it can move within the short span of time.
S&P500 is set to rebound to new highsDual EBP on the weekly and daily indicative of bullish price action and time frame allignment. S&P500 is set for new highs.

SPX Peaks at 6,100; Correction Toward 4,600 LikelyThe SP:SPX ’s rally, which kicked off at 3,500 in late 2022, climaxed around 6,100 in February 2025.
Since then, the trend has clearly reversed, and I expect the correction to persist. As long as the index remains below 5,800 (supply), downward momentum should continue.
A pullback toward 4,600 by 2026 appears plausible, with that level likely acting as resistance or support—warranting a fresh assessment upon arrival.
In the near term, the SPX is likely to trade within a 5,100–5,700 range.

S&P500 INTRADAY resistance at 5510Earnings season heats up with major companies like Visa, Coca-Cola, Starbucks, UPS, and Pfizer reporting results. In Europe, HSBC announced a $3 billion share buyback, while BP shares dropped due to weaker cash flow.
In Canada, the Liberal Party is set to win a fourth term, but likely without a majority, which could lead to a coalition-style government.
Meanwhile, the Trump administration plans to ease auto tariffs on foreign parts used in U.S.-made vehicles, boosting Ford and GM shares in premarket trading.
Market Impact:
Watch for shifts in trade-sensitive sectors, supply chain plays (especially in tech), and defense stocks as geopolitical risk evolves.
Key Support and Resistance Levels
Resistance Level 1: 5670
Resistance Level 2: 5740
Resistance Level 3: 5820
Support Level 1: 5380
Support Level 2: 5310
Support Level 3: 5236
This communication is for informational purposes only and should not be viewed as any form of recommendation as to a particular course of action or as investment advice. It is not intended as an offer or solicitation for the purchase or sale of any financial instrument or as an official confirmation of any transaction. Opinions, estimates and assumptions expressed herein are made as of the date of this communication and are subject to change without notice. This communication has been prepared based upon information, including market prices, data and other information, believed to be reliable; however, Trade Nation does not warrant its completeness or accuracy. All market prices and market data contained in or attached to this communication are indicative and subject to change without notice.

SPX - LONGprice is moving well with trade talks easing and agreements potentially coming into place. I believe price will continue this bullish momentum

S&P 500 ,,, Update chartTrending possibility
As I mentioned in a previous analysis, the chart reacted to a strong support zone with a significant bullish candle, indicating an emotional response. This was followed by a small correction. One encouraging sign suggesting a potential move into the green zone is the considerable buying volume observed at the support level, potentially signaling the end of this correction.
According to my strategy, identifying a new uptrend involves breaking a descending trend line and moving decisively above a major level, such as 5500 on this chart. Therefore, if a strong bullish candle forms and closes above this key level, I will consider initiating new long positions.
It's crucial to remember that consistent success in this market relies on having a clear strategy and adhering to it diligently.
Good luck.
