STEEM Triangle Formation$STEEM is on a triangle with 5 waves formation. I love this pattern because it usually result to violent breakouts. This move is confirmed by RSI bullish Divergence. Goodluck! Not a financial advise.
STEEMBTC trade ideas

STEEMBTCAs seen on weekly chart, STEEM broke previous triangle formation and later also 20k support. Now 15k level is acting as strong support, has been retested several times. If STEEM won't hold this, I expect it to visit levels around 13k.
Trade idea:
- short entry at 49k
- target at 13k1 (will watch how it will behave around this level and adapt if necessary)
- stop loss at 15k9 (just to avoid initial spikes, can be lowered later)
Weekly chart:
Disclaimer: this idea is solely for my own purposes, to satisfy the ego, if it will work out ;)

Our Prediction for STEEM/BTCalso we can complete our way down till 11585 or a bit more in case we break the levels which shown in chart.
Please like and leave comment,we'll appropriate that a lot.
Best of Luck.
Crypto_Stars.

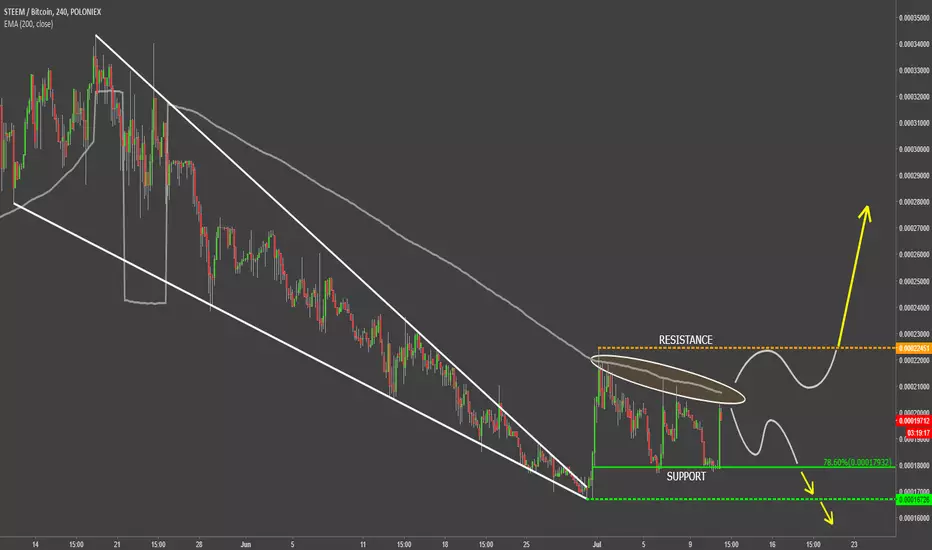
Steem VS Bitcoin Trying to Break HigherSteem has tested the bottom on the 30th of June, where price hit 16.7k satoshis low. After that price went up sharply breaking above the downtrend trendline and reaching the high at 22.4k satoshis.
The upside move resulted in a 34% Gain against the Bitcoin, and it seemed that STEEM/BTC is about to break even higher. However, price has rejected the 200 moving average and corrected down to the 78.6% Fibonacci support at 17.9k satoshis.
Currently STEEM is stuck between the Moving Average and the 17.9k satoshis support. At this stage consolidation could continue as STEEM does not have any directional pattern at this moment. But at the same time break above the 22.4k satoshis could be the first sign of a potential trend reversal or a strong corrective move up.
On the other hand, if the Fibonacci support is broken, STEEM is likely to re-test the 16.7k low and perhaps go even lower. Although buying opportunity is very tempting, perhaps safer trading would suggest to wait for the resistance breakout.

STEEM/BTC 0.0015₿ to 0.0083₿ soonSTEEM will go up soon compared to the bitcoin price like ~ 550%+ at least

STEEM - Great buy in priceDon't really need any TA to tell me that Steem is a great buy today. Last time I picked up at $1.33/steem and sold a couple days later at $1.65 , Had money sitting in USDT till now and bought back in around $1.18, still a good buy in my books. Don't advise anyone to follow my strategies I'm just trying to document some trades online to see how my profits compared to someone who actually does real TA since I don't really do any. Sometimes I may check the macd, stochrsi and bollinger bands if I am trying to day trade. But mostly I just buy something when I think it is a good price.


STEEMBTC - triangle pattern
RSI 4 hours: divergence signal happens.
OBV: even the price down, but it still keeps in the same. That means: people does not drop this coin, interest is kept.
Triangle pattern happens. Price is up over the edge.
Let's give it a try.

STEEM 7/16 Prediction
Due to the stagnant price action, the RSI is the biggest indicator
The oversold bounce lets me know the relative low has occurred or is soon to occur, preceding the reversal of a trend
The crossing of the MACD indicates an upward trend, waiting on the crossing over to the positive MACD
Looking for the crossing of the resistance line as another resistance

STEEM - Rocker pump and dump - Elliott WavesHello
Fan steem to see your arms offline
As the market is corrected, STEEM is falling, wave 5 may reach 14459 and then return to the medium term up to 65000 or more. a little.
Maybe this STEEM guy still does not make us all dizzy because in our opinion, when reaching the target 65xxx, STEEM again tweaked the correction of long wave to 5xxx, losing more than 90% of value, surely There must be a strong enough FUD in this area with STEEM
However, let's take a look at the areas that can be traded with STEEM in mid-wave:
EP: 14594
TP: Depending on you
TG: 65800
Do not forget SL if you do not want to become a holder
Like, share and follow us if you like
Thanks!

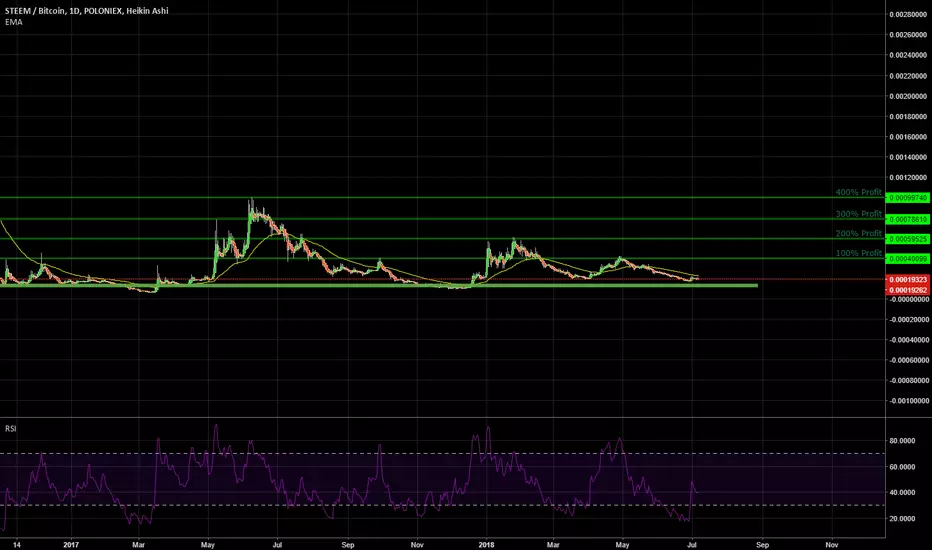
#STEEM Daily Chart with Levels, targets and FractalMy take on #Steem. Looks like a good spot (although there's the possibility of a retest of those lower levels). Added a fractal to show what I expect to see.


Steem OpportunityAnother great opportunity! Steem is a great project over all!
These are some of the better times to grab your alts when the markets in uncertainty! So much FUD people are selling and taking losses, this is when you should take action and purchase bags of your favorite alts - that are not shit coins obviously! You can add this to your list and keep watching it for cheaper entries when BTC starts making moves.
Use stop losses and trade smart :)
STEEM Ready to launch?!We have a sloppy cypher pattern and historically nice support area + bottom trendline bounces!
Leave a comment about Your thoughts and if You agree with me then hit the LIKE button!

STEEMIT is gathering steam!! I think its ready to pump, EW is pointing to that direction, also fib retracement is at 62%, everything seems to be inline for a rally. Stay tuned!

Steem Breaking Out From Falling WedgeSteem is one of the cryptocurrencies which have a very good potential in the near future. It is also another alternate currency that is undermined coins out there in the crypto market arena. Since May it formed a falling wedge which is basically because of Bitcoins effect on the overall market. It seems it ends it corrective elliot wave and is looking for a rally. Both RSI and volume showing a good strength of the coin. It already breaks the trend resistance line and if it can close above the first strong resistance at the 23.6% fib level around 28894 satoshi's we might see a further developed rally up to the 50% fib level in the mid term.
Possible Targets / Fib Levels
Target 1 : 28894 sats
Target 2 : 34953 sats
Target 3 : 39851 sats
Target 4 : 44748 sats
Good Luck.
Legal disclaimer:
Information on this channel is our team's analyst's "opinion" based on data available at this point in time. These opinions are not recommendations to buy or sell securities/commodities and cryptocurrencies. Trading and investing is a risk and you should not rely on this data to make any financial decisions. You must consult a financial advisory licensed by regulatory agencies in
your legal jurisdiction. All information stated here and in our reports don't gurantee any possible profits or losses. Please do consider to do your own due diligence and research when making any kind of a transaction with financial implications. With Regards. TeamTWA.

$STEEM, Ascending Triangle…
Weekly
Looking at our highest timeframe we see STEEM has formed an ascending triangle on our trend timeframe. Stochastic RSI showing momentum has almost bottomed out, expecting a push towards 35000 within the next couple of days.
4Hour
Shifting straight to our trigger timeframe we see price was rejected by our 28000 resistance zone. Stochastic RSI showing momentum is heading towards the downside, support level at 23750. A 4hour close above 26000 activates our buy trade, a close below 23750 and expect STEEM to fall towards 20000

STEEM FORMING THE RIGHT SHOULDER, 71 % OPPORTUNITY!Steem has been on a breakout yesterday, since one day it has made more than 25 % rise and has confirmed finishing the head and is just about to start the left shoulder pattern and has confirmed it with yesterday's spike. So now I am expecting Steem to finish its right shoulder pattern in the upcoming weeks where it should stop at 0.00043 BTC as there is downward pattern if we look at the tops it have been making with its left shoulder and head so we are going to meet the resistance when we intersect with the red line however if we break this trend I am expecting Steem to go up further to the price it has made with its left shoulder, in other words right shoulder will be the horizontal reflection of left shoulder where it will do its peak at 0.0005 BTC.
So my advice on this trade (this is a HODL trade), buy now sell when we come close and intersect with the red downward line and wait for the market to react if we break this trend then it is time to buy back but if we bounce back down from this trend it means we are on our way to finish the right shoulder by going to the bottom.
Good Luck, Traders!

STEEM Falling wedge pullbackHello guys,
today Im going to give you a little overview whats in my opinion a falling wedge.
As you can see I marked the first falling wedge as 1# after the long downwards trend in 1# we have seen in the 19920 zone a pullback.
Now its the same game again I belive! In falling wedge 2# weve seen a long downtrend from 42k to 17.3k and we're close to the 19920 zone again thats why I recomend:
Accumulate everything between 17105-19920
Stoploss: ~14589
Take profit you can do at the marked Resistance zones:
R1/TP1: 24090
R2/TP2: 29524
R3/TP3: 35164)

STEEM short-term trade!!!RSI is and MACD is looking very good, at previous support and a possible double bottom.
however, MACD have not crossed yet. Keep an eye on it!!!
target: 28,000 - 30,000 satoshi

STEEM/Bitcoin Cycles Warm For A Few Days-Big Chill Coming?STEEM/Bitcoin 12 Hour Bars, LOG Scale, 06/19/18, Written 3:35 p.m. EST, by Mike Mansfield
Hi trader friends, STEEM might get hot for a few days but don’t let if fool you. It should then cool off again for at least one to two more legs down before it can likely finish its larger Wave (C) decline. Price is more important than time, but even better when price & time suggests the same thing, as in the case here.
SUMMARY: BOUNCE THEN LOWER, SO LOOK FOR SHORT OPPORTUNITIES AFTER NEXT TWO WAVE 4 BOUNCES.
Currently on Andrews Median Median Line support after a 5 wave down. This should provide a smaller degree Wave 4 a bounce for several days to sell into.
Then, down again. Why?
Cycles, Elliott Wave count, Gann/Andrews/Schiff lines are all still bearish.
CM_Williams indicator has slight bullish divergence, enough to support a small degree Wave 4 bounce.
But, the fact that it made lower lows on the swing before, supports our longer-term bearish view.
Solid red and green arrows show most likely path.
Dashed red and green arrow show less likely path
NO BREAKOUT UP UNTIL:
1. Daily close above the pink dashed horizontal line, which, is the prior Wave (1) low, and would likely invalidate bearish view.
2. Daily close above the red Andrews pitchfork upper channel line.
3. Daily close above the blue dashed Gann 3:1 line, whichever of the three possibilities comes first.
ELLIOTT WAVES, BIG PICTURE:p
Most likely path appears to be larger ABC zigzag or larger ABCDE contracting pattern, but unclear as yet.
I show both, so if you move the chart around you should see larger picture wave counts. We do not yet know if STEEM will boil and take off up after the forecasted (C) wave low or simply have a larger Wave (D) bounce followed by a Wave E) wave low, perhaps into the apex of a contracting pattern. If STEEM does take off with high volume after the Wave (C) low, and moves up in clear non-overlapping 5 wave pattern, then STEEM could have the beginning of a new impulse wave up, sooner rather than later.
CYCLES:
Cycles are about potential general energy shifts, not necessarily exact turning points. Sometimes they invert, sometimes they are perfectly timed with market highs and lows.
Cycles, are meant for general trend guidance.
Blue cycle = general trend thus far. Next trough, September 25, 2018.
Green cycle aligned with the 3 major lows. Next trough, August 26, 2018.
Red cycle tends to catch intermediate highs. Next trough, July 29th. This could be telling if the market gets unusually strong after July 29th. Watch for that date to see if the energy shifts dramatically up.
General guidance: Look for SHORT opportunities into possible lows around the end of July,, end of August, end of September.
NOTE: Do not use cycles alone!
We really like the SteemIt platform and hope it keeps growing! Definitely check out SteemIt as a competitor for Medium.com and eventually, perhaps other social media sites like Facebook and YouTube, since SteemIt integrates with Dtube and “pays” you for content, unfettered by the powers that seek to control free speech and hold some blockchains down until they have their own versions to gain even more power.
BOTTOM LINE:
More cooling off ahead after two Wave 4s of different degrees have their short-term pop ups.
Then down again to complete at least a Wave (C) low, possibly lower, or a Wave (E) apex in a wedge or triangle.
Lows in the end of July, end of August, and/or end of September, 2018.
DISCLOSURE:
This analysis is meant for educational purposes only. You trade at your own risk!
Cheers!
Michael Mansfield CIO
