STXUSDT trade ideas

STX USDT—x2 fast and easy from here —daily -read the descriptionHi dear friends , I can explain many very bullish signal for this chart but this need to zoom on chart from variety views in different timeframes , but meanwhile I shared a general picture from this chart that can show main bullish stream cause , it broken historical high and after 10 day and consolidation above historical high is ready for parabolic move , and you can see a big green shadow on red line in consolidation period , it is very bullish candle that we calling this pinbar , dear friends you can not take all coins profit in market so please trade wisely without excitement , You should choose a good coin and enter and wait for targets and exit from trade and repeat ... STX is undervalue and very bullish, easy x2 , daily timeframe
Follow me

STX potential target with Sperandeo at 1H chartHere is a Sperandeo target you can see at the top; the yellow line.
Sperandeo Analysis works very effectively these days. Let's wait and see if the target comes.


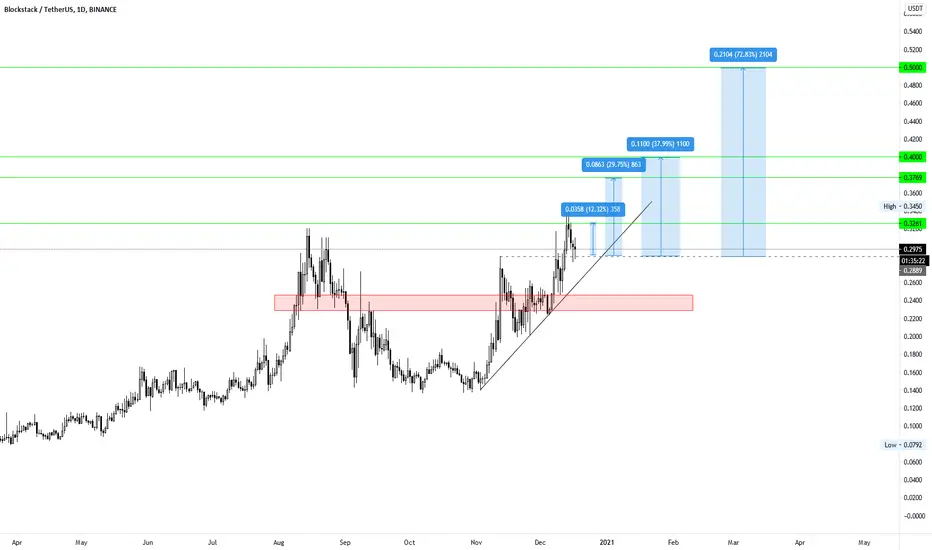
STXUSDT - Long - Potential 13.22%STXUSDT - Long - Potential 13.22%
Entry- 4693
TP1- 4939
TP2- 5317
SL- 4377
- BTC - Volatile as ever. Manage trade.
- RR - 2.05
- Trailing Buy - 0.5%
- Trailing Profit - 1%
- Trailing Stop-Loss - No


STX get ready for Rising againSTX is in a rising trend line (according to its daily ichimoku chart and trending line)
be aware for breaking up the Flag Pattern, then you can open your positions


blockstack a good option for medium-term investment.🍕STX/USDT (1D) has several events in the coming months and will grow well due to the uptrend of the daily chart and good support at low prices.🚀🚀

STXUSDT completing Cypher | 29.9% expectedOn small time period one hour chart, the price action of Blockstack (STX) is completing the final leg of Cypher pattern , and soon it will be entered in potential reversal zone. There is also 200 simple moving average support in PRZ level.
Buying And Sell Targets:
The buying and sell targets according to BAT pattern should be:
Potential reversal or buying zone: $0.2704 to $0.2501
Fibonacci projection or sell zone: $0.2863 to $0.3249
Stop Loss:
The potential reversal zone area that is up to $0.2501 can be used as stop loss in case of complete candlestick closes below this level.
Possible profit and loss ratio:
As per above targets this trade has a profit possibility of 29.90% and as per the above-mentioned stop loss, the loss possibility is 8%.
Note: Above idea is for educational purpose only. It is advised to diversify and strictly follow the stop loss, and don't get stuck with trade.

STX will Rise again in few hoursSTX/USDT is in a rising channel and going to up after a retrace and will gain 7% in few hours
buy: 0.2990
TP1: 0.3200 (0.786 FIBO)
SL: 0.2950

STXUSDT LONG TRADESTXUSDT LONG TRADE
Signal: Blue -> Green
Context: Light Green
Trade close manually when: the above ribbons turns Yellow or better Red.
I appreciate your like or comment. Welcome to share your idea here.
DISCLAIMER
This is only a personal opinion and does NOT serve as investing NOR trading advice.
Please make your own decisions and be responsible for your own investing and trading Activities.


STXUSDT - Long - Potential 8.91%STXUSDT - Long - Potential 8.91%
Entry- 2433
TP1- 2557
TP2- 2642
SL- 2256
- MANAGE TRADES- BTC VOLATILITY STILL HIGH
- RR - 1.28
- Trailing Buy - 0.5%
- Trailing Profit - 1%
- Trailing Stop-Loss - No

STX/USDT - Long - Potential 11.18% ***NEW TRADE SET_UP"**
STX/USDT - Long - Potential 11.18%
Optional Leverage: N/A
Entry- 2371
TP1(75%) -2508
TP2- (25%) - 2636
SL- 2194
- MANAGE TRADES- BTC VOLATILITY STILL HIGH
- RR - 1.5
- Trailing Buy - 0.5%
- Trailing Profit - 1%
- Trailing Stop-Loss - No


STXUSDTPERP - Long - Potential 17.71%***NEW TRADE SET_UP"**
STXUSDTPERP - Long - Potential 17.71%
Optional Leverage: 3X - 5X
Entry- 2338
TP1(75%) - 2533
TP2- (25%) - 2752
SL - 2160
- MANAGE TRADES- BTC VOLATILITY & BIG DROP POSSIBLE
- RR - 2.33
- Trailing Buy - 0.5%
- Trailing Profit - 1%
- Trailing Stop-Loss - No

STXOn the chart we can see bearish channel we follow, but i also marked Fibonaci retracement from D1 chart last price break. On 1 hour chart it looks like we are in golden support zone fibonaci retracement and we are slightly down on long term trend line from March 2020. But on D1 chart is only overlaping or candle knots. If we break this long term support line we can see bullish pump at least to target fibo 0,236.
