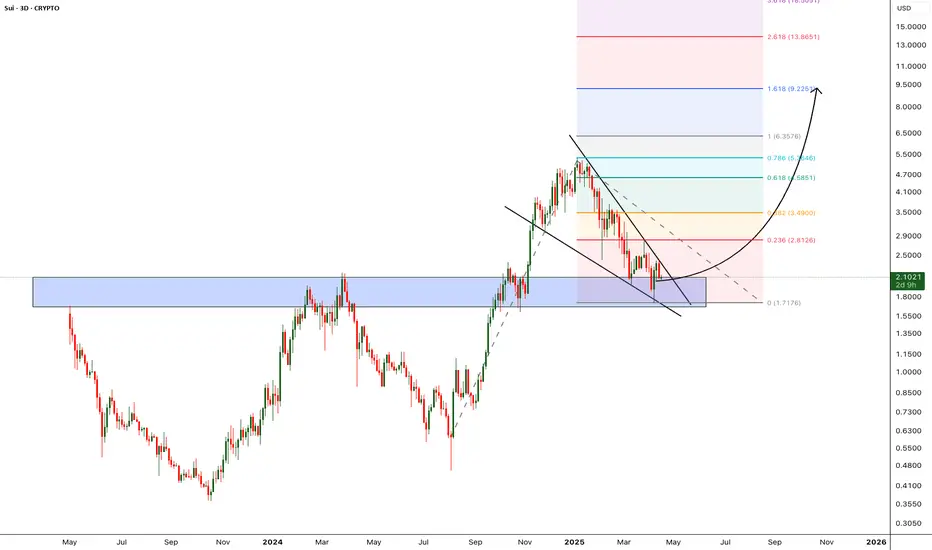
SUIUSD is consolidating ahead of massive Leg. Can it hit $9.500?Sui (SUIUSD) has completed Stage 1 of its recovery process following the April 07 bottom. That was a Higher Low on the 2-year Fibonacci Channel Up and having already broken above both the 1D MA50 (blue trend-line) and 1D MA200 (orange trend-line), the price is now consolidating.
This is fairly simi

SUIETH bull 3-6 monthsSUIETH bull 3-6 months bull signal based on fundamentals and cyclicality of refinancing debt in the world

SUI PERPETUAL TRADE, Sold From $3.45SUI PERPETUAL TRADE
SUI SELL SETUP
Currently $3.45
Sold From $3.45
(Trading plan If SUI go up to $3.60
will add more shorts)
Expecting target $3.34 OR DOWN
Incase of early exist will update this anaylsis
Its not a Financial advice

SUI extremely bullish Marked the important levels in this video for this week and considered a few scenarios of price performance, also in this video I considered the global possible price movement
Important support for this week is the 2.9-3 zone
Write a comment with your coins & hit the like button and I will make an

Shorting Sui how Far Down Are We Going ? 3.3 -3.0 ? Here is my trade I just entered with stop loss and take profit zones 1 and 2. Let me know what you think
Kris/Mindbloome Exchange
Trade Smarter Live Better

SUI STILL SHORT(SELL) FROM THESE LEVELS $3.64-3.80SUI PERPETUAL TRADE
Good short entry levels now ($3.64 - $3.80)
SUI still have room to go down towards
Targeting
$3.37
$3.23
(3.13 & 3.03)
Its not a Financial advice

Build a Bag on SUI USD Levels Definitely like the tech behind SUI - developed by Mysten Labs, founded by ex-Meta engineers with expertise in blockchain scaling. It has raised significant funding and partnered with major players like Circle and Phantom.
Still relatively cheap to get in and able to Build a Bag with these support

SUI PERPETUAL TRADE , Sold at $2.91SUI PERPETUAL TRADE
SUI SELL SETUP
Currently $2.91
Sold at $2.91
(Trading plan If SUI/USDT up to $3.10 will add more shorts)
Expecting target $2.81 OR DOWN
Incase of early exist will update this anaylsis
Its not a Financial advice

SUI - Double Digit is next - Alt season LeaderCorrection of the SUI is over, currently trading around the previous Support zone. i'm expecting this support to hold and bounce back from the support zone.
Once the price breaks from the falling wedge pattern we can expect the bullish momentum to start and hit new all time high.
Entry: after we
Weekly plan for SUIIn this video I considered the global possible price movement, also made possible scenarios for the current week
Right now the price is between two important levels and there is a chance that the correction will start soon
Write a comment with your coins & hit the like button, and I will make an

See all ideas
Summarizing what the indicators are suggesting.
Oscillators
Neutral
SellBuy
Strong sellStrong buy
Strong sellSellNeutralBuyStrong buy
Oscillators
Neutral
SellBuy
Strong sellStrong buy
Strong sellSellNeutralBuyStrong buy
Summary
Neutral
SellBuy
Strong sellStrong buy
Strong sellSellNeutralBuyStrong buy
Summary
Neutral
SellBuy
Strong sellStrong buy
Strong sellSellNeutralBuyStrong buy
Summary
Neutral
SellBuy
Strong sellStrong buy
Strong sellSellNeutralBuyStrong buy
Moving Averages
Neutral
SellBuy
Strong sellStrong buy
Strong sellSellNeutralBuyStrong buy
Moving Averages
Neutral
SellBuy
Strong sellStrong buy
Strong sellSellNeutralBuyStrong buy
Displays a symbol's price movements over previous years to identify recurring trends.