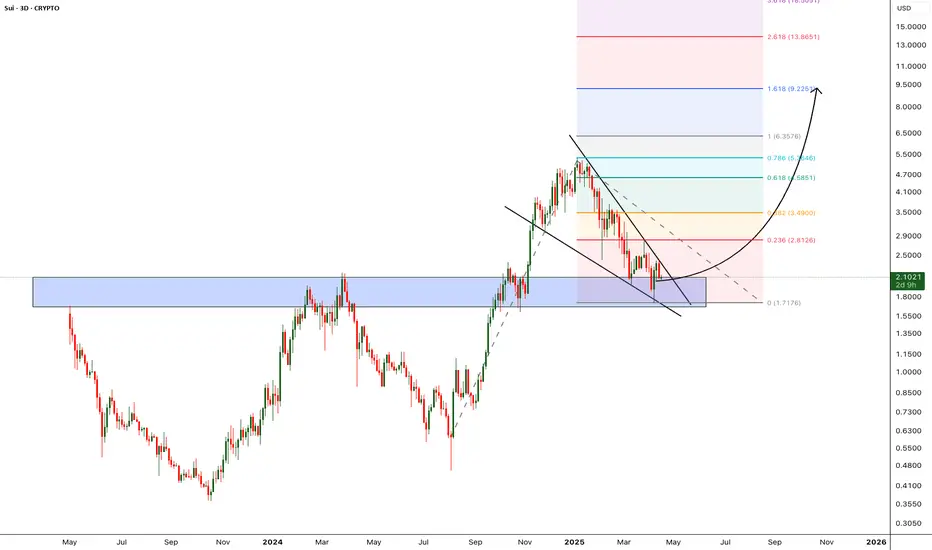
SUIUSD is consolidating ahead of massive Leg. Can it hit $9.500?Sui (SUIUSD) has completed Stage 1 of its recovery process following the April 07 bottom. That was a Higher Low on the 2-year Fibonacci Channel Up and having already broken above both the 1D MA50 (blue trend-line) and 1D MA200 (orange trend-line), the price is now consolidating.
This is fairly similar to what it did on September 20 2024, which was followed by a strong rise to the 1.0 Fib (previous High) where the price pulled-back to the 1D MA50. That was its final test before the peak forming rally just above the 1.5 Fibonacci extension.
As a result, we expect SUI to hit at least $9.500 on the long-term.
-------------------------------------------------------------------------------
** Please LIKE 👍, FOLLOW ✅, SHARE 🙌 and COMMENT ✍ if you enjoy this idea! Also share your ideas and charts in the comments section below! This is best way to keep it relevant, support us, keep the content here free and allow the idea to reach as many people as possible. **
-------------------------------------------------------------------------------
💸💸💸💸💸💸
👇 👇 👇 👇 👇 👇
SUIUSD.P trade ideas

SUIETH bull 3-6 monthsSUIETH bull 3-6 months bull signal based on fundamentals and cyclicality of refinancing debt in the world

SUI PERPETUAL TRADE, Sold From $3.45SUI PERPETUAL TRADE
SUI SELL SETUP
Currently $3.45
Sold From $3.45
(Trading plan If SUI go up to $3.60
will add more shorts)
Expecting target $3.34 OR DOWN
Incase of early exist will update this anaylsis
Its not a Financial advice

SUI extremely bullish Marked the important levels in this video for this week and considered a few scenarios of price performance, also in this video I considered the global possible price movement
Important support for this week is the 2.9-3 zone
Write a comment with your coins & hit the like button and I will make an analysis for you
The author's opinion may differ from yours,
Consider your risks.
Wish you successful trades! MURA

Shorting Sui how Far Down Are We Going ? 3.3 -3.0 ? Here is my trade I just entered with stop loss and take profit zones 1 and 2. Let me know what you think
Kris/Mindbloome Exchange
Trade Smarter Live Better

SUI STILL SHORT(SELL) FROM THESE LEVELS $3.64-3.80SUI PERPETUAL TRADE
Good short entry levels now ($3.64 - $3.80)
SUI still have room to go down towards
Targeting
$3.37
$3.23
(3.13 & 3.03)
Its not a Financial advice

SUI PERPETUAL TRADE , Sold at $2.91SUI PERPETUAL TRADE
SUI SELL SETUP
Currently $2.91
Sold at $2.91
(Trading plan If SUI/USDT up to $3.10 will add more shorts)
Expecting target $2.81 OR DOWN
Incase of early exist will update this anaylsis
Its not a Financial advice

Build a Bag on SUI USD Levels Definitely like the tech behind SUI - developed by Mysten Labs, founded by ex-Meta engineers with expertise in blockchain scaling. It has raised significant funding and partnered with major players like Circle and Phantom.
Still relatively cheap to get in and able to Build a Bag with these support zone levels
Support Zone 1: $1.69 - $1.94
Support Zone 2: $0.55 - $0.67

SUI - Double Digit is next - Alt season LeaderCorrection of the SUI is over, currently trading around the previous Support zone. i'm expecting this support to hold and bounce back from the support zone.
Once the price breaks from the falling wedge pattern we can expect the bullish momentum to start and hit new all time high.
Entry: after wedge breakout
Target 1: 2.8
Target 2: 3.49
Target 3: 4.5
Target 4: 5.3
Target 5: 6.3
Target 6: 9.2
SL below 1.68
Cheers
GreenCrypto
Weekly plan for SUIIn this video I considered the global possible price movement, also made possible scenarios for the current week
Right now the price is between two important levels and there is a chance that the correction will start soon
Write a comment with your coins & hit the like button, and I will make an analysis for you
The author's opinion may differ from yours,
Consider your risks.
Wish you successful trades! MURA

Sui broke above the wedge & is already over halfway 2 the targetSUUSD has had a very notable pump on this uptrend which hopefully will end up being the beginning of confirming a real sustained uptrend in the alt market. *not financial advice*

SUI has traded back up the the equilibrium zone.As many of us already know, SUI has the ability to make some really big moves very quickly, and it's currently trading at the bottom of the equilibrium zone.
This will be very interesting to watch.
Good luck, and always use a stop-loss!

UPDATE ON SUI SELL PERPETUAL ,MORE SHORTS FROM $3.40Update on SUI SELL PERPETUAL TRADE
Added more shorts from $3.37 &3.40
Some taking profit points from top
$3.11
$3.02
$2.92
Targeting $2.92-2.89
Its not a Financial advice

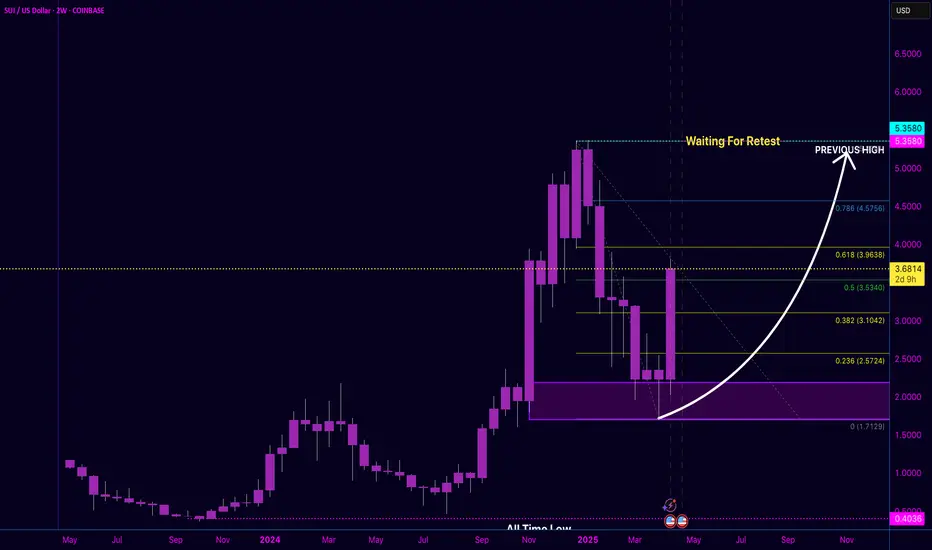
SUI / USD – Weekly Structure Flip in Progress This chart is saying loud and clear:
We may have just printed a bottom.
📈 After bouncing from the All-Time Low Zone, SUI surged with authority, reclaiming the .236 Fib and now eyeing .382 at $3.10+.
What I'm seeing:
✅ Bullish engulfing from demand
📊 Clear Fibonacci levels aligning with volume interest
🟣 Target area: $5.35 zone (Previous High) marked as "Waiting for Retest"
If this structure holds and momentum builds, we could see a Fibonacci wave toward the .618 at $3.96 and potentially a full retest into previous highs. But remember — confluence matters.
💡 This is why structure and candle maturity mean everything.
I’m not just reacting — I’m observing.
📍 Keep an eye on price behavior around the .382 level. That’s the next chess move.
#SUI #CryptoMarket #AltcoinSeason #ChartAnalysis #SmartMoneyFlow #FibonacciLevels #BreakoutWatch
SUI Trade Setup – Early Reversal PlaySUI has just swept underside liquidity around $1.80, reclaiming key support and showing signs of a potential trend reversal. If it holds this higher low and breaks above $2.40, that would likely confirm a bullish structure shift and open the door for a strong move up.
📍 Entry Zone:
Around $2.25
🎯 Take Profit Targets:
🥇 $2.73
🥈 $3.40
🥉 $4.00
🛑 Stop Loss:
Daily close below $2.00

Will the growth of SUI continue ?In this idea I marked the important levels for this week and considered a few scenarios of price performance
Locally, the price is in the correction phase and the main reversal can be expected from the zone $2.7-$2.8
Write a comment with your coins & hit the like button and I will make an analysis for you
The author's opinion may differ from yours,
Consider your risks.
Wish you successful trades ! mura

SUI - A closer lookIn my previous SUI analysis, I currently have us in an impulse structure leading into the 5th wave.
Zoomed out, it seems we're still in a corrective structure. Looking to short at the TP of the long.

SUI: The Bullish Continuation#Sui led the market during the Aug–Dec 2024 rally. Since then, it has been in a corrective wave (4) within a larger bullish structure. A trend reversal might happen soon to target the ~$10 level.
Passing $3.57 confirms that, while breaking $1.71 would call for reassessment.

suiusdti believe we are not out of the woods yet, there are still a lot of uncertainty and still there will be one more drop

SUI: Toward All-Time Low?SUI broke the support at $1.97 and tested it once again from below with yesterday's brief countermovement. It should now proceed downward so that the turquoise corrective wave 2 can be properly completed. Subsequently, the turquoise impulse wave 3 should provide new upward momentum, racing toward new all-time highs. The resistance at $5.36 should only be a milestone.

SUIUSDTSui Ranging Area none trading.
DISCLAIMER:
what I share here is just personal research, all based on my hobby and love of speculation intelligence.
The data I share does not come from financial advice.
Use controlled risk, not an invitation to buy and sell certain assets, because it all comes back to each individual.

SUIUSD - Bearish Head and ShouldersA head and shoulders pattern that allows the creation of a slight up channel in blue
Circles in red show the head and shoulders pattern
Daily timeframe

SUI/USDT Price Action & Trade Setup – Key Support & Resistance LThis 1-hour chart of SUI/USDT showcases a significant price drop, with the price currently testing a key support level around $2.275. The highlighted red zone represents a resistance area near $2.345, while the blue zone indicates a potential downside target if the bearish momentum continues. The 200-period moving average (MA) at $2.4416 suggests that the price is trading below a key dynamic resistance level. Traders should watch for potential rejection at resistance or a breakdown below support to confirm further movement.
