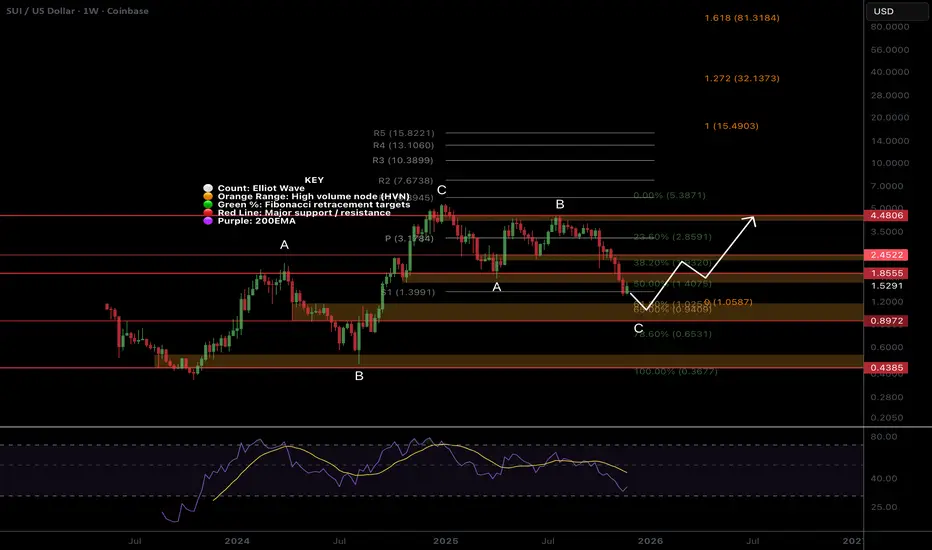
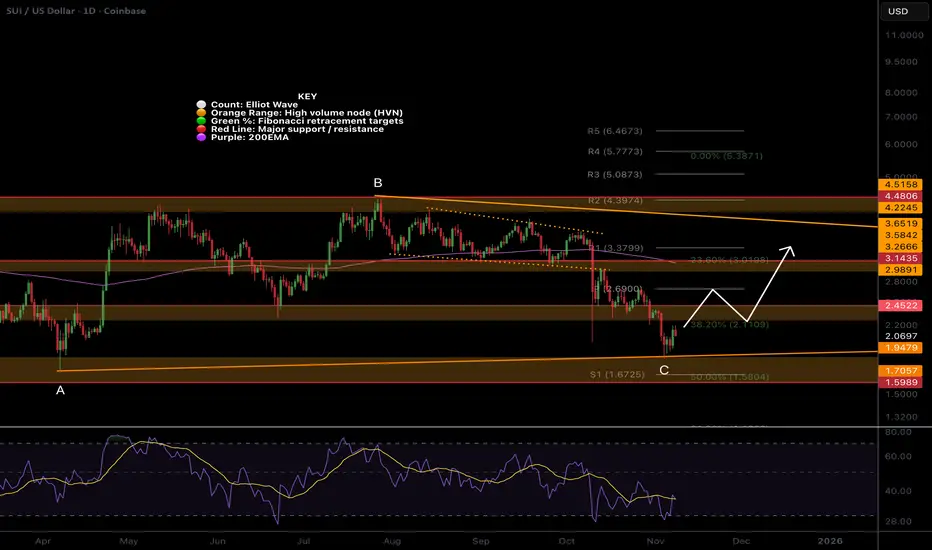
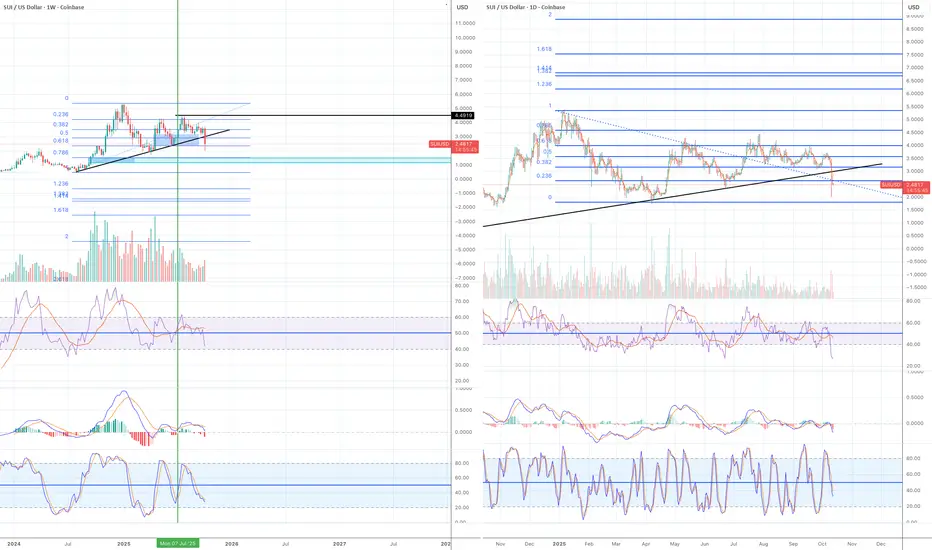
SUI Macro outlook changed...Price appears to be near the completion of a wave C correction.
Price is falling below the S1 pivot, bringing up the next target of the golden pocket and High Volume Node. There is no weekly 200EMA. The series of macro ABC’s suggests upside targets may be limited to the R3 pivot.
🎯 Terminal target for the business cycle could see prices as high as $10 based on weekly pivots
📈 Weekly RSI is bearish, almost oversold with no divergence
👉 Analysis is invalidated below wave B at $0.43
Safe trading
Trade ideas
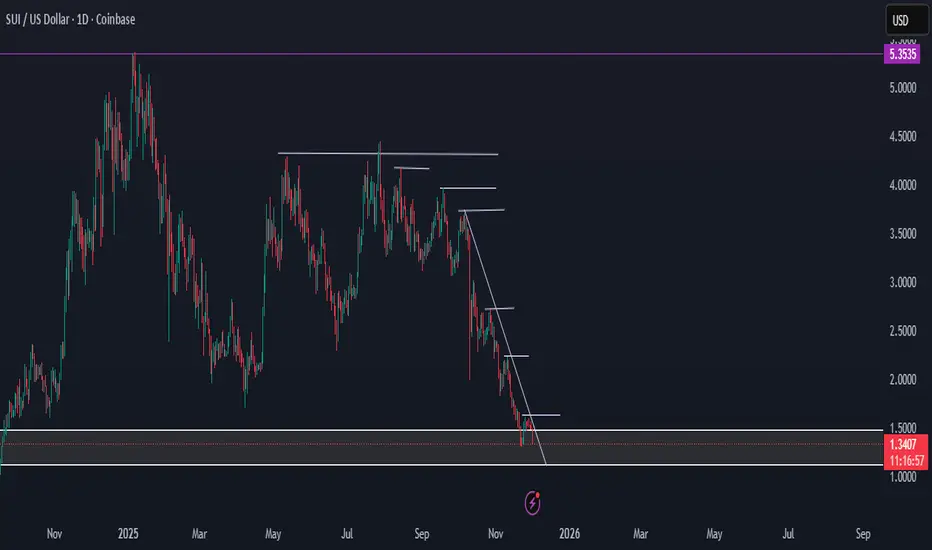
SUI/USD 01 DEC 2025Sui is currently filling in market fair value gap (FVG) $1.50 to about $1.12 if price continues lower after reaching market fair value thinking price will attempt to sweep liquidity around $0.75-$0.65 for some accumulation and bullish movement. Setting alerts for each level of interest.
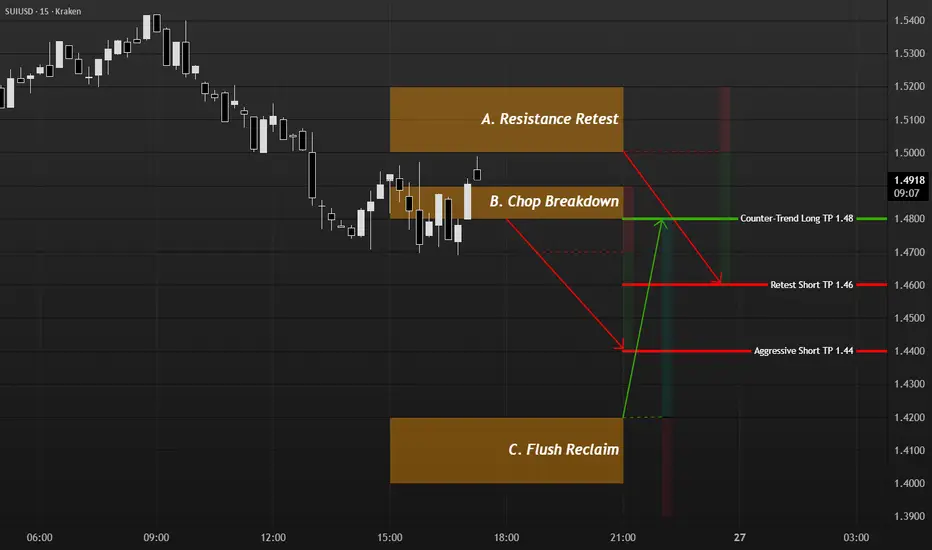
SUI intraday while BTC stallsBTC is chopping at key levels, so I’m not forcing trades there. Instead I’m using SUI on Kraken: strong push up from 1.33 to 1.55 on 24th, then clear distribution and break lower, which gives three structured ideas.
A. Base case: short a failed retest of 1.50–1.52 after rejection, invalidation above 1.54–1.55, targeting 1.46 then 1.42.
B. Aggressive: if price grinds under 1.48 and breaks, I look to sell a retest from below with the same invalidation and target at 1.44.
C. Counter-trend: I only consider a long after a sharp flush into 1.40–1.42 and a clean reclaim on 15m; below 1.40 the bounce idea is off.
This is a map, not signals. I size so a full stop costs about 0.5% of equity and take partial profits at the first target.
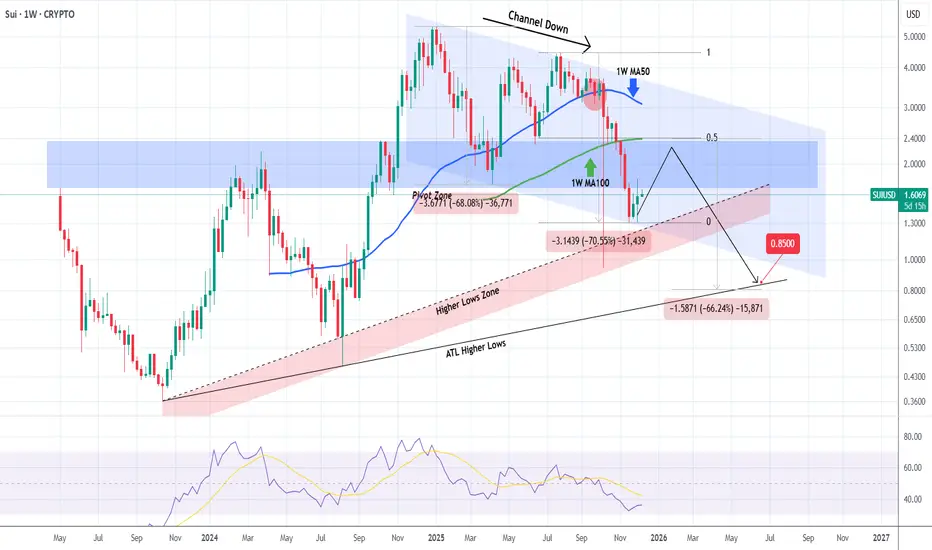
SUIUSD can target $0.85 after this dead-cat bounce is over.A month ago (November 05, see chart below) we gave a strong sell signal on Sui (SUIUSD), targeting 1.4320 right at the bottom of its 1-year Channel Down:
The price made direct contact with the pattern's bottom (thus hitting our Target) and rebounded, pricing a Lower Low. Right now the market is in the process of forming the Bullish Leg of the Channel Up (1W RSI almost got oversold also), which we don't expect to be completed like the previous one as this is a dead-cat bounce at the time, limited by the 1W MA50 (blue trend-line), which is technically the Resistance during Bear Cycles.
The 0.5 Fibonacci retracement level is also at a cluster level were the 1W MA50 could reject this bounce along with the 1W MA100 (green trend-line). We believe that the next Bearish Leg will likely break below the Channel Down and target the All Time Low Higher Lows trend-line around 0.8500, which will be a -66.00% decline from the top, similar to the previous two selling sequences.
---
** Please LIKE 👍, FOLLOW ✅, SHARE 🙌 and COMMENT ✍ if you enjoy this idea! Also share your ideas and charts in the comments section below! This is best way to keep it relevant, support us, keep the content here free and allow the idea to reach as many people as possible. **
---
💸💸💸💸💸💸
👇 👇 👇 👇 👇 👇
SUI Dropped hard! More to come?Price accelerated in a downtrend, falling below a major High Volume Node support, invalidating the macro triangle.
Wave C of a textbook ABC correction is underway with a target of the golden pocket. and S2 pivot at $1.
📈 Daily RSI is oversold with no divergence
👉 Continued downside has a next target of $1
Safe trading

SUI/USD - Weekly Chart AnalysisThe price action on the weekly timeframe shows SUI moving within a well-defined bullish flag pattern, characterized by a strong impulsive move upward followed by a controlled, downward-sloping consolidation channel.
🔹 Pattern Structure
The overall structure forms a bullish flag, which is typically a continuation pattern appearing after a strong upward rally.
The price is currently trading near the lower boundary of the flag, an area that has historically acted as dynamic support throughout the consolidation phase.
The repeated bounces from this region highlight ongoing demand and suggest the pattern remains valid.
🔹 Market Behavior
The pullback within the flag appears orderly, with price respecting the upper and lower trendlines of the channel.
Volume behavior also supports the flag structure:
Momentum expanded during the impulsive rally, then contracted during consolidation—typical of a healthy continuation setup.
🔹 Potential Scenario
If the lower boundary continues to hold:
The chart suggests a potential upward breakout from the flag.
This breakout would align with the larger trend and indicate a continuation of the previous bullish leg.
A breakout from the flag’s upper trendline would confirm the move and open the way for a new expansion phase.
🔹 Summary
SUI is consolidating within a bullish flag, maintaining its structure and showing signs of strength at support. As long as the lower channel boundary remains intact, the pattern favors a continuation of the broader uptrend.

SUI Technical Analysis — Is a Major Reversal Coming?SUI is currently moving inside a large descending channel, consistently respecting both the upper and lower trendlines. Price is now approaching a critical decision zone where two scenarios become likely.
Bearish Scenario (Red Path)
If the current weakness continues, SUI may drop toward the bottom of the channel, which aligns with the long-term rising trendline.
• Support Zone: $0.70 – $0.75
This area is the strongest confluence of support on the chart.
A bounce from here would be highly probable.
Bullish Scenario (Green Path)
If SUI holds above the lower boundary and shows a reversal pattern, we can expect a recovery toward the mid-range of the channel.
• First Target: $1.63
• Second Target: $2.38 (midline + major horizontal level)
A break above the midline could signal a trend shift.
Suggested Trade Plan
• Entry Zone: Around $0.75 – $0.80 (lower channel + long-term trendline)
• Stop-Loss: $0.60 (below channel + invalidation level)
• Target 1: $1.63
• Target 2: $2.38
Risk/reward becomes highly favorable only if price gets closer to the lower trendline.

SUIUSD; Heikin Ashi Trade Idea📈 Hey Traders!
Here’s a fresh outlook from my trading desk. If you’ve been following me for a while, you already know my approach:
🧩 I trade Supply & Demand zones using Heikin Ashi chart on the 4H timeframe.
🧠 I keep it mechanical and clean — no messy charts, no guessing games.
❌ No trendlines, no fixed sessions, no patterns, no indicator overload.
❌ No overanalyzing market structure or imbalances.
❌ No scalping, and no need to be glued to the screen.
✅ I trade exclusively with limit orders, so it’s more of a set-and-forget style.
✅ This means more freedom, less screen time, and a focus on quality setups.
✅ Just a simplified, structured plan and a calm mindset.
💬 Let’s Talk:
💡Do you trade supply & demand too ?
💡What’s your go-to timeframe ?
💡Ever tried Heikin Ashi ?
📩 Got questions about my strategy or setup? Drop them below — ask me anything, I’m here to share.
Let’s grow together and keep it simple. 👊

SUI-eet Setup????This could be a textbook reversal structure for SUI but this market has been so unpredictable, who knows. Regardless, this is an EXCELLENT entry opportunity for long term holders!!!!
SUISUI Long idea. Interesting if they break ~$2.175. There is also a potential dragon here with classic bullish divergence on the oscillators.

SUI remains in a shallow Fib triangleCRYPTOCAP:SUI Price remains in a downtrend, falling below a major High Volume Node support, tapping the macro triangle lower boundary.
Wave C of the triangle appears complete. If this count is correct, we should accelerate to the upper boundary around $3.6 over the next month or so, with some difficulty at the daily 200EMA and pivot as resistance.
📈 Daily RSI printed bullish divergence from oversold
👉 Continued downside loses the triangle pattern, and the next target is $1.6
Safe trading
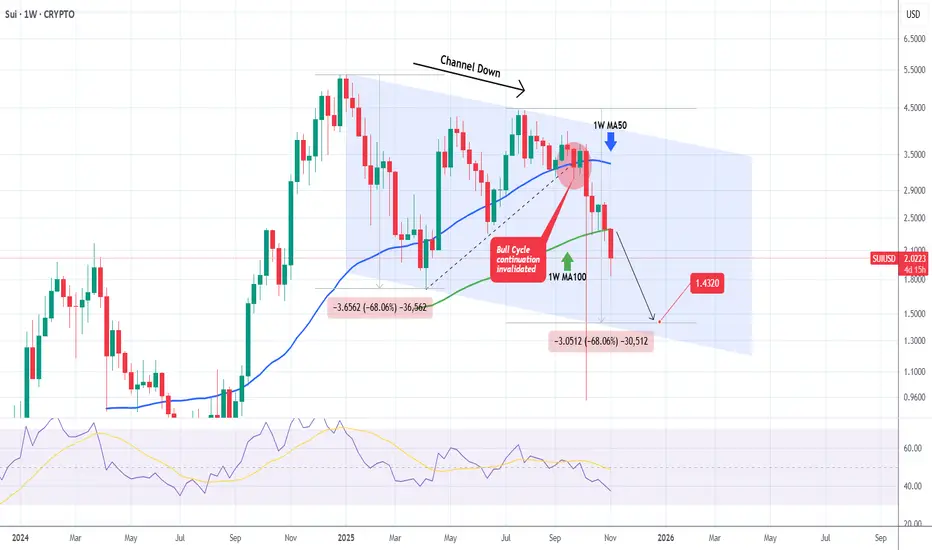
SUIUSD Channel Down to accelerate more selling towards 1.4320.Sui (SUIUSD) has established a Channel Down on the 1W time-frame, trading under Lower Highs since the December 30 2024 High. The Bull Cycle got invalidated on September 22 2025 when the price broke below the inner Higher Lows trend-line (dashed) and this week may confirm the new Bear Cycle as it will most likely close a 1W candle below the 1W MA100 (green trend-line).
We expect the current decline to repeat at least the -68.06% drop of the first Bearish Leg of the pattern and targe 1.4320.
-------------------------------------------------------------------------------
** Please LIKE 👍, FOLLOW ✅, SHARE 🙌 and COMMENT ✍ if you enjoy this idea! Also share your ideas and charts in the comments section below! This is best way to keep it relevant, support us, keep the content here free and allow the idea to reach as many people as possible. **
-------------------------------------------------------------------------------
💸💸💸💸💸💸
👇 👇 👇 👇 👇 👇
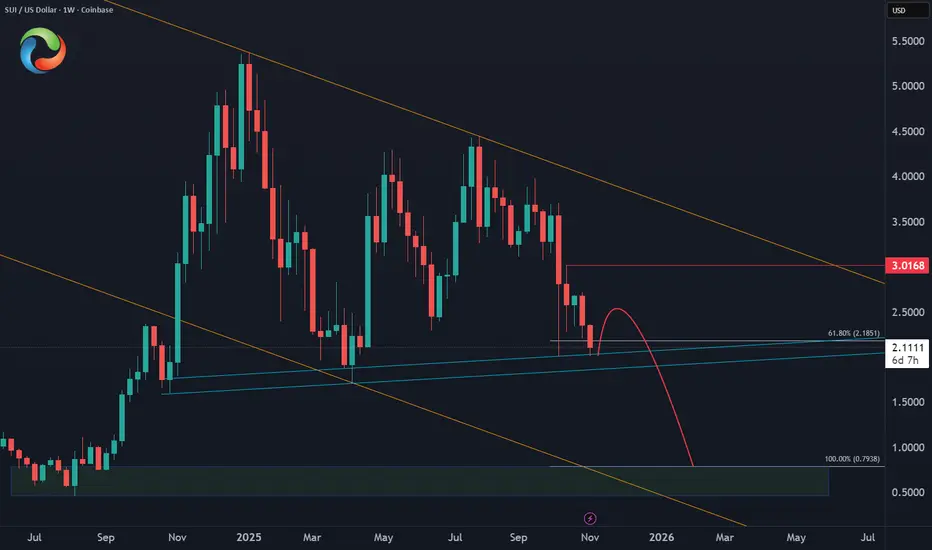
SUI – Mid-Term Projection📊 COINBASE:SUIUSD continues to respect the channel from October 2024, currently finding support near the 61.8% Fibonacci extension zone. This area could still fuel a bounce this month, offering short-term relief.
However, unless price breaks decisively above $3, the structure remains corrective, likely forming a lower high. That would set the stage for sellers to re-enter, targeting a swing move lower below $1 in the coming months.
#ElliottWave #Trading #Altcoins
SUI: SlippedSUI recently faced renewed pressure but is expected to recover soon. The magenta wave is likely to extend slightly further toward resistance at $4.57, where we anticipate this wave will peak. Afterward, a short-term correction in wave is likely before wave should drive price sustainably above the $4.57 level. A lower bottom would only become likely if support at $0.55 is breached. In that scenario, an alternative wave alt.B in turquoise would come into play, which we currently estimate has a 37% probability.

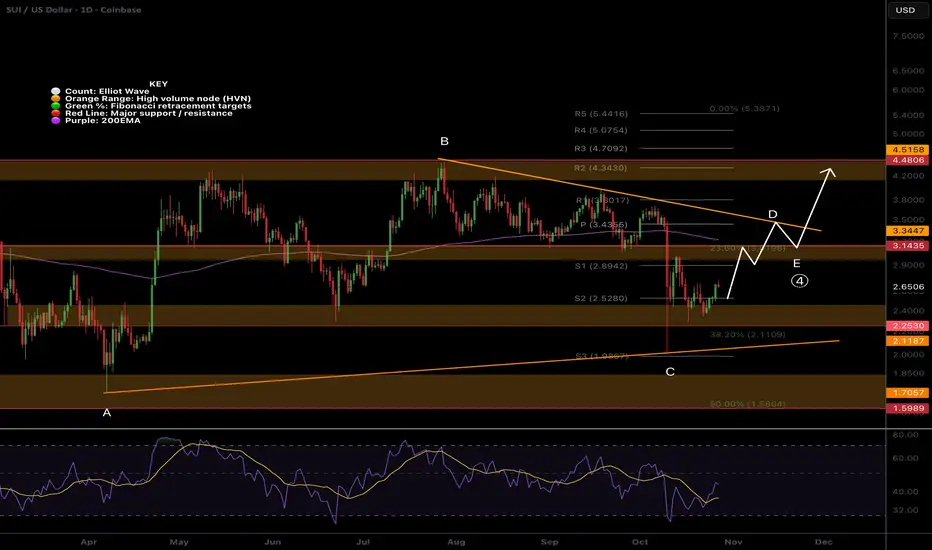
SUI remains in macro triangleNothing changed form last update, plan is playing out. Wave (c) of D is underway and should test the triangle upper boundary and find resistance at the High Volume Node along the way- $3.14.
Daily RSI hit oversold with no divergence. wave E is expected to be shallow
Safe trading
SUI/USD – Losing Steam After Sharp Rally📉 Bias: SHORT (corrective move in progress)
Sui trades at $2.61, pulling back after hitting resistance at $2.68. Price remains above the SMA200 ($2.55), but momentum has faded — RSI down to 39, showing sellers regaining control.
A sustained close below $2.55 could confirm a deeper retracement toward $2.52–$2.48, while bulls must reclaim $2.68 to restart the upside leg.
📊 Key Levels:
Resistance: $2.68 / $2.72
Support: $2.55 / $2.48

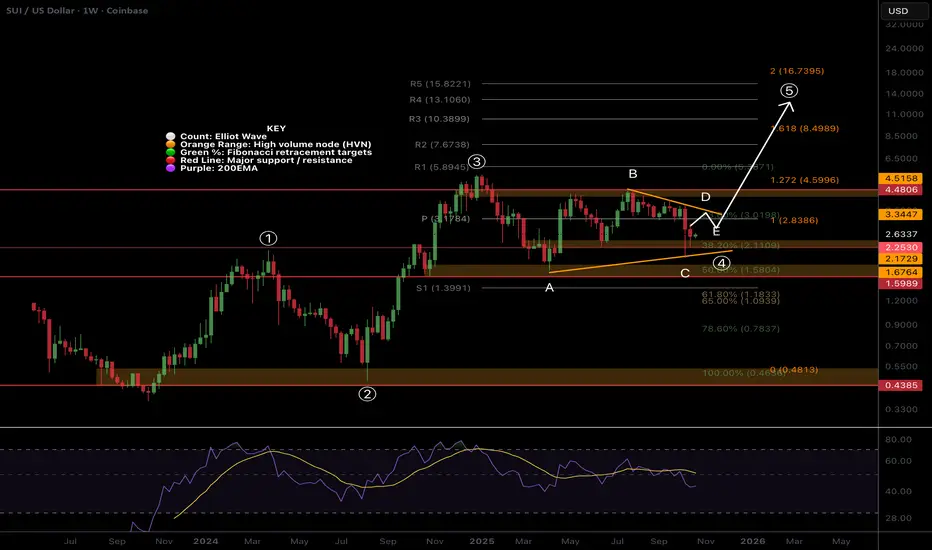
SUI Triangle macro outlookCRYPTOCAP:SUI structure, after a failed all time high, now appears to be a macro triangle in wave (4), also characterised by the long drawn out range. Wave D is underway to the triangle upper boundary with wave E expected to complete around the weekly pivot point, $3.17.
Wave (5) has a minimum target of the R5 weekly pivot at $15.8, at the 2 Fibonacci extension.
Falling below $1.7, wave A, invalidates the analysis and suggests we have much lower to go in a bear market.
Weekly RSI is bearish with lower to go but hidden bullish divergence has formed, a good raly will confirm.
SUI i holding up better than most with shallower retracements overall.
Safe trading
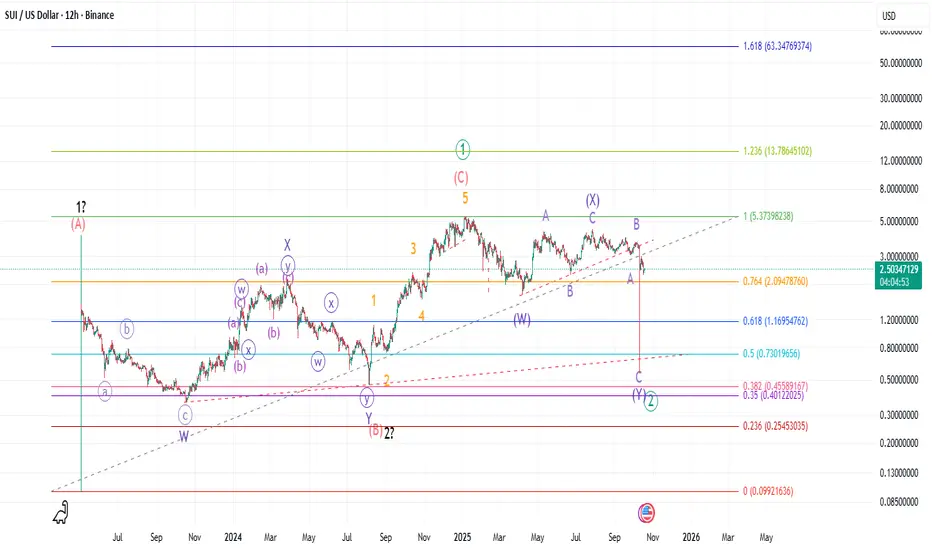
SUI: Moonboy sentiment is over!!! But still can be bullish!SUI bullish price action stalled when it failed to break higher in September, putting an end to a series of 1/2 moves to bed then crashing into the October low. The actual low is debatable, but Binance seems to have gotten hit the hardest, so let's go with that. Now the 5 wave moves in between seem to be parts of a and C waves of various degrees. Depending on how the next price action unfolds, there could be 2 bullish options.
1. Less bullish leading diagonal: In this scenario, we should see 3 wave move up to make new highs for primary wave 3. The lazier the start, the stronger validation for this scenario. Depending on, if the structure is expanding or contracting, the target could be somewhere in between $11 to $70 in the next two years or so. Lazier the action, lower the target. As long as the last wick low holds SUI can chug along.
2. More bullish 1/2, 1/2: In this scenario, the current price action is even a lower degree, maybe a minute degree 1/2 in progress. In this scenario, there is no room for additional downtime. Price needs to move soon and very strongly. Price can correct a bit more, maybe test the $1.5 support, but things cannot drag on for months. Decision time should be in a couple of weeks give or take one week. After that, macro wave 3 or 3 of 3 of 3 should be the strongest and longest leg for SUI.
3. Bear case: If the black Friday wick low is lost, then things will look really nasty. It may take a while for SUI to recover.
I still believe in the technological fundamental that drives the hype. In theory it is the perfect fit for AI driven economy and content. Will it translate into real life use cases, we will have to wait and see. I did add to my bag during the crash and still holding. If price falls below $1.5, then will need to reassess the whole situation.
SUI Triangle emerged!CRYPTOCAP:SUI appears to be in a triangle wave D.
Wave b of D should complete at the High Volume Node support $2.4 before testing the upper boundary trend-line, $3.6 just above the daily 200ema.
If this is a triangle then we should see a huge breakout later in the year into price discovery similar to XRP in 2024 and that would mark the top for SUI as triangle breakouts are a terminal pattern! Targets could go as high as $15
Safe trading

Very bearish - waiting for re-entry
Sui price action is very bearish. I am waiting for an opportunity to re-enter.
Weekly:
The price broke below the ascending support line. The current weekly candle hasn't completed yet, but a Friday daily candle broke and closed below the support line.
RSI and Stochastic have moved to the bear zone.
MACD lines have crossed to the downside and are starting to move to the bear zone.
Daily:
All momentum indicators are in the bear zone.
My plan:
There is a large unmitigated fair value gap in the $1.1-15 zone (blue rectangular box in the weekly chart).
If the price does not recover from $2.5 (Fib 0.618), it is likely to drop to 0.786 level and it is where FVG sits.
0.786 often works as the last line of defence. It the price doesn't recover from there, I won't be buying SUI.
SUI Still holding up strong!Price has still not reached the 0.5 Fibonacci retracement and appears to have been front run. Wave (4) is intact but no higher high since then is a cause for short-term concern. A triangle could be forming, or an expanded flat correction! Time will tell…
Price is below the weekly pivot, RSI is negative with room to fall and no bullish divergence forming. Further downside brings up the S1 weekly and major High Volume Node support at $1.4-1.6 range.
Wave (5) has a minimum target of the R4 weekly pivot at $13.1.
Safe trading

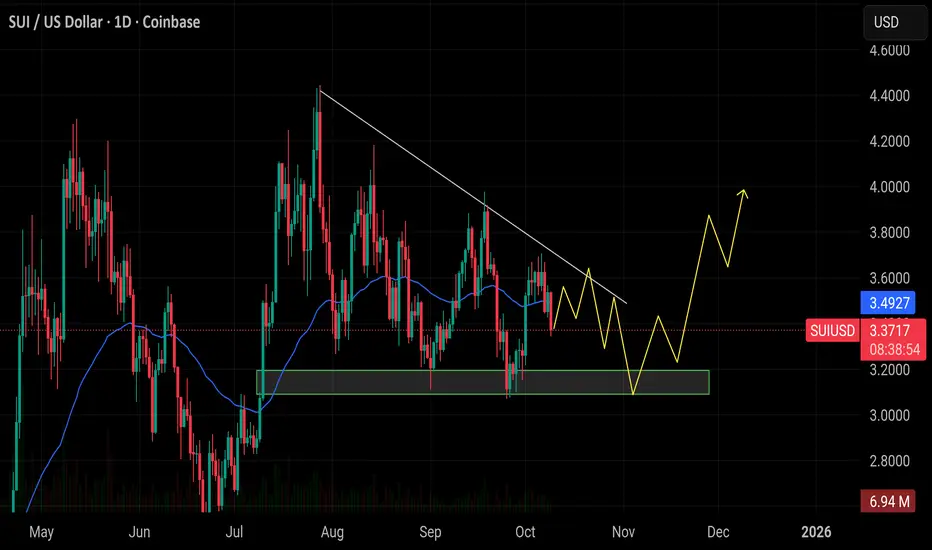
$SUI is forming a bullish structure on the daily chartCRYPTOCAP:SUI is forming a bullish structure on the daily chart, consolidating near support around $3.1. A breakout above the descending trendline could trigger a move toward the $4 zone.
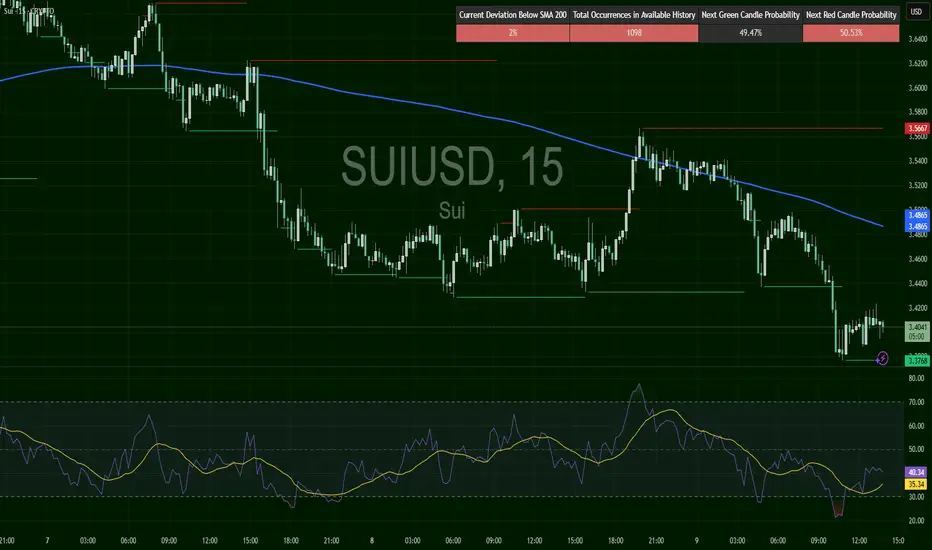
SUI/USD – Weak Below Trendline🔴 Bears still in control under SMA200 ($3.49)
Sui trades at $3.40, holding near $3.38 support. RSI 39, showing limited recovery from oversold conditions. Resistance at $3.57.
📖 Keywords: #SUIUSD #Sui #AltcoinSetup #CryptoMomentum