SUI - Leveraging Fibonacci & Elliott for Precision TradesSUI’s movement is rapid, sharp swings—both up and down. In volatile conditions like this, we aim 0.702–0.786 fib retracements (and occasionally 0.886 in harmonic contexts) for high‑probability entries. Below is a clear, Elliott-focused breakdown of the current setup and both long and short trade pla

SUI Looks Bearish (2H)From the point where we placed the red arrow on the chart, it appears that the correction in SUI has begun.
An expansionary wave structure is visible, which could potentially push SUI toward the green zone.
Targets are marked on the chart. As long as the supply zone holds, the price may move towar

SUI/USDT Approaches Critical Resistance After Explosive Move SUI has posted an impressive run, climbing over 75% in a short window. But now, the price is stalling beneath a major resistance zone — a region where several key technical factors overlap. A temporary pullback looks likely before any potential continuation of the uptrend.
Key Highlights:
- SUI st

SUI/USDT is currently reacting from a well-defined demand zone bSUI/USDT is currently reacting from a well-defined demand zone between 3.32–3.44, with multiple confluences suggesting bullish potential. A clear bullish reaction is forming off this base, giving a solid risk/reward opportunity.
Trade Plan:
Entry: 3.4682
Stop-Loss: 3.2718 (below the demand zone)

Fibonacci Setup: SUI Targeting 4.40 With 26% Upside RoomHello and greetings to all the crypto enthusiasts, ✌
All previous targets were nailed ✅! Now, let’s dive into a full analysis of the upcoming price potential for SUI 🔍📈.
SUI has demonstrated remarkable growth in recent days and is now nearing a key resistance level. Based on Fibonacci analysis, I

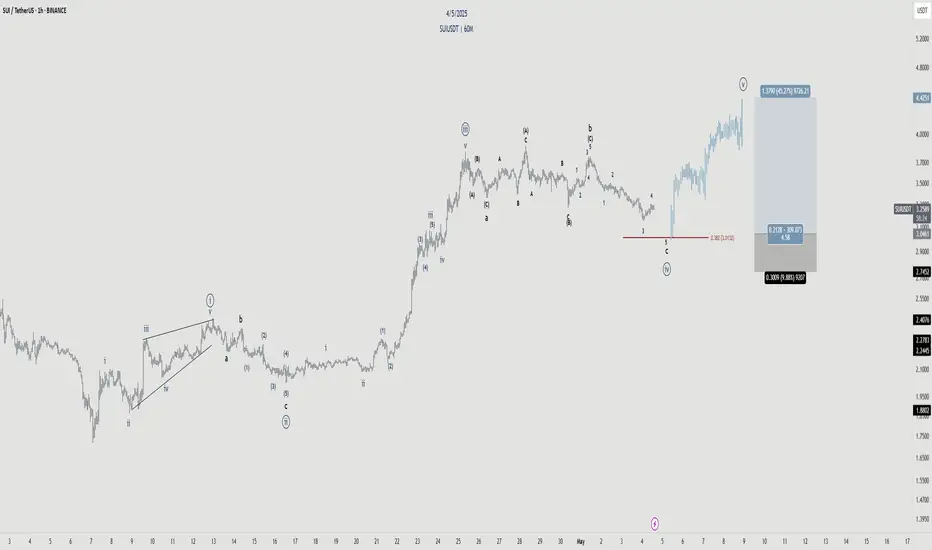
SUI - Incoming wave 5Wave structure is very defined.
Currently looking for the completion of this corrective sequence of Wave 4 before we bounce at the key level 38.2%.
Targeting the high.
SUIUSDT Potential DownsidesHey Traders, in today's trading session we are monitoring SUI/USDT for a selling opportunity around 3.40 zone, SUI/USDT is trading in a downtrend and currently is in a correction phase in which it is approaching the trend at 3.40 support and resistance area.
Trade safe, Joe.

SUI H4 Possible pathThe likely direction of this currency is predicted to be re-buying and joining the upward trend. When the price reaches the trend line and the specified support area, it can be purchased in steps.

Sui Just Broke Trend line and massive Upward move ^_^
🟢 Breakout ✅
🟢 Trendline flip ✅
🟢 Long setup activated with exit at key resistances
🔴 Short position still inactive – needs clear break below red trendline
📉 Buy zones for shorts:
🟢 TP1 – $3.18 (25% entry)
🟢 TP2 – $2.96 (Main entry – 50%)
🟢 TP3 – $2.76 (Degens only 🧨)
🧠 Strategy: No FOMO. Wait fo

SUI sell pressure incoming can it hold the line?SUI unlocks could cause dilution-sell pressure; however, if the SUI bulls are strong enough, they may absorb the unlock. Momentum is overbought and could come down, which is a good recipe to buy the dip.
Full TA: Link in the BIO

See all ideas
Summarizing what the indicators are suggesting.
Oscillators
Neutral
SellBuy
Strong sellStrong buy
Strong sellSellNeutralBuyStrong buy
Oscillators
Neutral
SellBuy
Strong sellStrong buy
Strong sellSellNeutralBuyStrong buy
Summary
Neutral
SellBuy
Strong sellStrong buy
Strong sellSellNeutralBuyStrong buy
Summary
Neutral
SellBuy
Strong sellStrong buy
Strong sellSellNeutralBuyStrong buy
Summary
Neutral
SellBuy
Strong sellStrong buy
Strong sellSellNeutralBuyStrong buy
Moving Averages
Neutral
SellBuy
Strong sellStrong buy
Strong sellSellNeutralBuyStrong buy
Moving Averages
Neutral
SellBuy
Strong sellStrong buy
Strong sellSellNeutralBuyStrong buy
Displays a symbol's price movements over previous years to identify recurring trends.