SUI - Leveraging Fibonacci & Elliott for Precision TradesSUI’s movement is rapid, sharp swings—both up and down. In volatile conditions like this, we aim 0.702–0.786 fib retracements (and occasionally 0.886 in harmonic contexts) for high‑probability entries. Below is a clear, Elliott-focused breakdown of the current setup and both long and short trade plans.
Before diving into the charts, let’s cover the basics of Elliott Wave Theory. Elliott Wave Theory provides a roadmap for market psychology by dividing price action into two distinct phases:
1. Impulse Phase (Waves 1–5)
Wave 1: The spark that ignites a new trend as early adopters push prices beyond the prior range.
Wave 2: A corrective pullback that tests the strength of the emerging trend, often retracing 38–61.8%.
Wave 3: The powerhouse wave—typically the longest and most dynamic—driven by broad market participation and often extending to key Fibonacci levels (1.618, 2.618).
Wave 4: A consolidating correction that digests gains and builds the base for the final thrust; it must not overlap Wave 1 territory in a classic impulse.
Wave 5: The final leg of the advance, often fueled by last bursts of optimism and weaker hands.
2. Corrective Phase (Waves A–B–C)
Wave A: Initial counter-trend reaction as profit-taking begins.
Wave B: A deceptive retracement back toward the trend, frequently trapping traders.
Wave C: The concluding leg of the correction, which typically tests or breaks the low of Wave A before the next cycle begins.
Key Points:
Impulse waves showcase momentum and structural clarity, often aligning with Fibonacci extensions.
Corrective waves follow Fibonacci retracements (38.2%, 50%, 61.8%), offering optimal entry points.
Wave 3 is seldom the shortest; Wave 4’s complexity sets the stage for Wave 5’s final push.
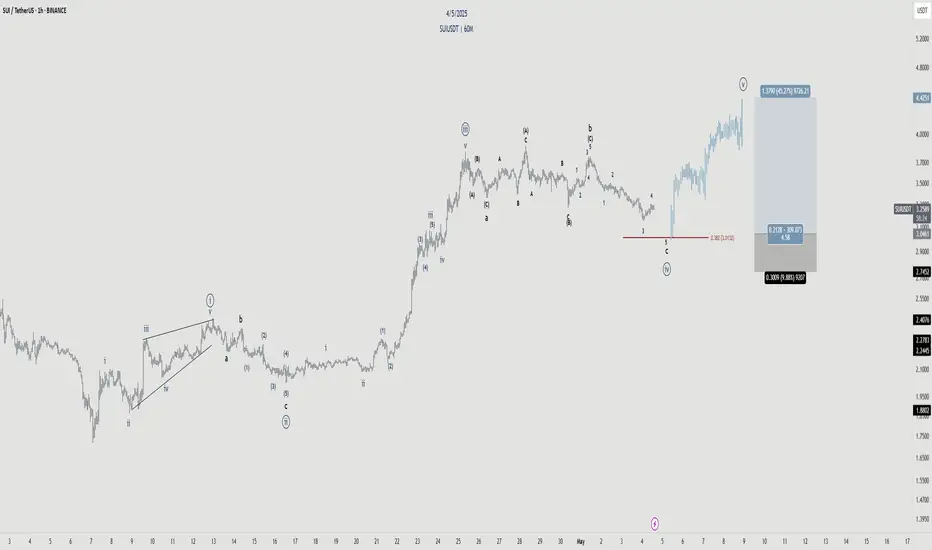
In the current SUI structure:
Wave 1 ignited the initial rally.
Wave 2 delivered a healthy retracement, a pullback close to the 0.618 fib, setting the stage for stronger momentum.
Wave 3 roared to a powerful peak topped at the 2.618 extension ($3.875)
Now, we’re deep into Wave 4, likely an ABC corrective pattern. This pause is critical—it gathers energy before the final push of Wave 5. Below is a clear breakdown of each wave, big-picture confluences, and trade setups.
🚀 Elliott Wave Overview
1. Wave 1 & Wave 2
Wave 1: Quick surge from $2.4175 → $2.75, setting initial momentum.
Wave 2: Pulled back close to the 0.618 fib, creating a solid launchpad.
2. Wave 3: The Power Move
Peak: Hit the 2.618 extension of Wave 1→2 and aligned with the –2 extension of Wave 1.
Significance: In strong bull markets, a run to the 2.618 extension often precedes a meaningful pullback. Here, Wave 3’s exhaustion suggests a retrace toward the 38.2% Fib of that advance—our ideal Wave 4 entry zone.
3. Wave 4: The Correction
All eyes on the $3.17 level—the projected 1:1 extension of A→B and 0.382 fib retracement of Wave 3. This confluence zone is yet to be tested and could offer an ideal Wave 4 entry.
ABC Pattern: Currently working on Wave C.
4. Wave 5: The Finale
Target Zone: $4.00–$4.35, with strong focus at $4.31
Extension Levels:
1.133 → $3.9695 aligns with the 0.618 fib retracement.
1.272 → $4.0683 is close to the weekly resistance level.
1.412 → $4.1678 alings with the 0.666 fib retracement.
1.618 → $4.3142 alings with the key swing high.
🔑 Key Confluence Levels
Golden Pocket: $3.9739–$4.1492 (90-day retrace).
Speed Fan 0.618: Support around $3.15.
Fair Value Gap:
Psychological: $3.00 major support.
📈 Long Trade Setup
Entry Ladder: $3.25–$3.111 (stack orders to DCA)
Stop‑Loss: $3.07 (just below the 0.786 Fib low)
Profit Targets:
Fib 1.133 at $3.9795 ($4 psychological & partial take‑profit)
Fib 1.272 at $4.0683
Fib 1.412 at $4.1678
Fib 1.618 at $4.3142
Risk:Reward: ~6:1+ (average entry around $3.20 → SL at $3.07 → TP1 at $3.9795)
📉 Short Trade Setup
Entry Zone: $4.00–$4.35 (sweet spot at weekly level/yearly open)
Confirmation: Bearish reversal candle or volume spike down
Stop‑Loss: Above $4.35
Target: $3.77 (near Wave 3 high turned support)
Risk:Reward: ~2:1 (varies with DCA entry)
⚙️ Summary & Game Plan
Primary Bias: Long in the $3.25–$3.111 zone—stack into the 0.382-0.412 fib retracement entries with tight SL, aiming for the $4.00–$4.30 upside zone.
Alternate Bias: Short on a clear rejection within $4.00–$4.35, targeting $3.77 or lower.
Risk Management: Keep stops tight to maximize R:R.
Patience & Confirmation: Wait for price to reach these zones and show reversal signals (price action, volume, patterns) before committing.
All set—now let SUI’s swings unveil the opportunities. Sit tight, follow your plan, and let patience pay its dividend.
Happy Trading!
____________________________________
If you found this helpful, leave a like and comment below! Got requests for the next technical analysis? Let me know.
SUIUSDT.P trade ideas

SUI Looks Bearish (2H)From the point where we placed the red arrow on the chart, it appears that the correction in SUI has begun.
An expansionary wave structure is visible, which could potentially push SUI toward the green zone.
Targets are marked on the chart. As long as the supply zone holds, the price may move toward the targets and the green box.
A 4-hour candle closing above the invalidation level will invalidate this analysis.
For risk management, please don't forget stop loss and capital management
When we reach the first target, save some profit and then change the stop to entry
Comment if you have any questions
Thank You

SUI/USDT Approaches Critical Resistance After Explosive Move SUI has posted an impressive run, climbing over 75% in a short window. But now, the price is stalling beneath a major resistance zone — a region where several key technical factors overlap. A temporary pullback looks likely before any potential continuation of the uptrend.
Key Highlights:
- SUI stalling at major resistance formed by Fib, VWAP, and range high
- Early signs of a swing-failure pattern — possible short-term top forming
- Support region sits between $2.70 and $2.40 for a potential higher low
The reaction from the range high resistance is not a surprise, especially as price approaches it with weakening momentum and lower volume. The confluence of the 0.618 Fibonacci retracement and VWAP from recent rallies makes this level a clear area for profit-taking or short setups.
If the price begins to rotate back toward the $2.70–$2.40 region, traders should monitor how it interacts with the range mid and previous structure support. This area could be the staging ground for another leg higher — possibly a wave 3 extension — if buyers step in with strength. Until then, expect range-bound behavior to persist as SUI looks for fresh direction.

SUI/USDT is currently reacting from a well-defined demand zone bSUI/USDT is currently reacting from a well-defined demand zone between 3.32–3.44, with multiple confluences suggesting bullish potential. A clear bullish reaction is forming off this base, giving a solid risk/reward opportunity.
Trade Plan:
Entry: 3.4682
Stop-Loss: 3.2718 (below the demand zone)
Target: 3.9542 (previous high)
Risk:Reward Ratio: ~1:2.5
The price structure shows possible bottoming with a strong demand zone rejection. If momentum builds, a move toward the 3.95 region is likely. This trade favors patience and risk control.
Not financial advice. DYOR.

Fibonacci Setup: SUI Targeting 4.40 With 26% Upside RoomHello and greetings to all the crypto enthusiasts, ✌
All previous targets were nailed ✅! Now, let’s dive into a full analysis of the upcoming price potential for SUI 🔍📈.
SUI has demonstrated remarkable growth in recent days and is now nearing a key resistance level. Based on Fibonacci analysis, I anticipate an additional 26% upside potential. My primary price target is set at 4.40, with key support levels clearly identified.📚🙌
🧨 Our team's main opinion is: 🧨
SUI has surged recently, is close to major resistance, and with support mapped by Fibonacci, I’m aiming for a main target of 4.40 — expecting about 26% more upside.📚🎇
Give me some energy !!
✨We invest hours crafting valuable ideas, and your support means everything—feel free to ask questions in the comments! 😊💬
Cheers, Mad Whale. 🐋

SUI - Incoming wave 5Wave structure is very defined.
Currently looking for the completion of this corrective sequence of Wave 4 before we bounce at the key level 38.2%.
Targeting the high.
SUI H4 Possible pathThe likely direction of this currency is predicted to be re-buying and joining the upward trend. When the price reaches the trend line and the specified support area, it can be purchased in steps.

SUIUSDT Potential DownsidesHey Traders, in today's trading session we are monitoring SUI/USDT for a selling opportunity around 3.40 zone, SUI/USDT is trading in a downtrend and currently is in a correction phase in which it is approaching the trend at 3.40 support and resistance area.
Trade safe, Joe.

Sui Just Broke Trend line and massive Upward move ^_^
🟢 Breakout ✅
🟢 Trendline flip ✅
🟢 Long setup activated with exit at key resistances
🔴 Short position still inactive – needs clear break below red trendline
📉 Buy zones for shorts:
🟢 TP1 – $3.18 (25% entry)
🟢 TP2 – $2.96 (Main entry – 50%)
🟢 TP3 – $2.76 (Degens only 🧨)
🧠 Strategy: No FOMO. Wait for proper confirmation.
📈 Volume fading, but price holding – classic setup for retest or fakeout.
💬 Comment your thoughts below or share your setup!
👉 Follow for more clean and memetic TA with Miracle 🐸
🔔 @TradeWithMky – where Altcoins speak louder than Bitcoin!

SUI sell pressure incoming can it hold the line?SUI unlocks could cause dilution-sell pressure; however, if the SUI bulls are strong enough, they may absorb the unlock. Momentum is overbought and could come down, which is a good recipe to buy the dip.
Full TA: Link in the BIO

SUIUSDT - Don't wait for pullback!SUI is the star of this season — on the 3-day chart, it just broke out of a falling wedge pattern with a massive green candle.
The price also reacted strongly to the 0.618 Fibonacci level, indicating there’s still plenty of upside potential ahead.
Don’t wait for pullbacks — coins like this rarely give clear entry opportunities, and any correction is usually very shallow.
It’s either you buy now, or regret it later.
Best regards Ceciliones 🎯

SUI 4HWe are still waiting for a correction to come to the market. BTC dominance will probably peak with this correction. I showed the possible places where SUI can come in this correction on the chart. Lots of profits.
SUI Drip Drip Driping DownSUI is looking more like it's 4th wave is going to go down a bit more before it can bounce up to $4.00. I really was hopeful that May 5th's $3.26 was it's recent retracement bottom... but it looks like we are about to revisit $3.26 and go even lower.
My target range is between $2.80 and $3.08, with my best guess as $2.88 as it will touch a previous high and will settle near the fib golden zone.
At the time I am posting this, the price is hovering around $3.24 and BTC is nearing 94k.
I think the market overall is going to be very nervious on 6 May, the day before the Fed's 7th May meeting.

SUI SIGNAL...Hello friends
As you can see, buyers entered the price correction and a reversal pattern is being built...
Due to the buying pressure and the entry of buyers, we can buy within the specified ranges and move towards the set targets, of course with capital and risk management.
*Trade safely with us*

SUI UPDATEHello friends✌
As you can see, after a price drop, buyers were able to break the downtrend and form an ascending channel, which, given the entry of buyers, we can buy in batches with capital and risk management to move towards the specified goals.
*Trade safely with us*


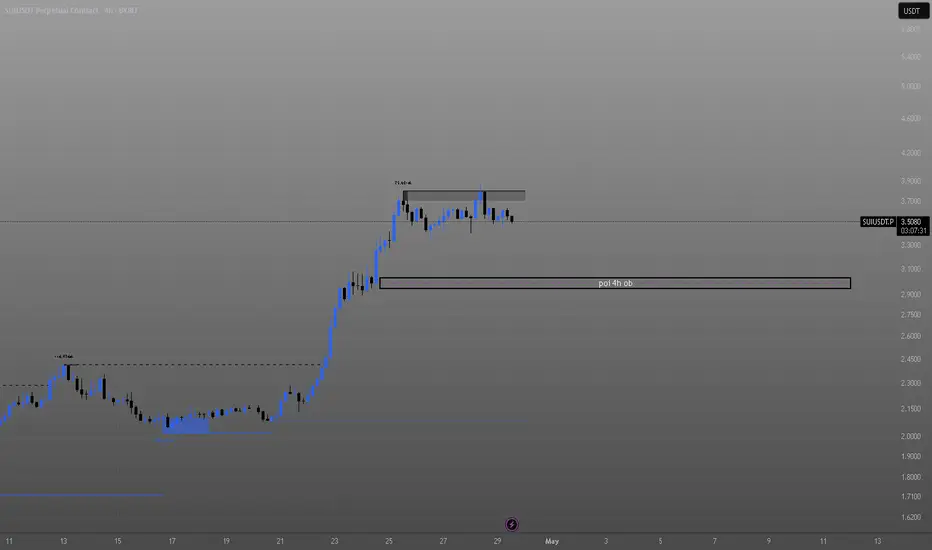
SUISUI has been ranging for a quite a while and I am now looking for a sweep of swing lows and a tap of the 4h ob as seen on the chart. I will wait for a valid confirmation before entering with leverage although im putting a risk entry on the equilibrium of the OB
SUIUSDT: Bullish Breakout from Rounding Bottom FormationSUIUSDT presents a rounding bottom formation, with price action successfully breaking and closing above the neckline resistance, confirming a strong bullish continuation signal. The immediate plan is to monitor the defined Buy Back Zone for potential re-accumulation opportunities should price retrace.
The neckline region, now converted into a key demand area, is expected to act as major support in case of any pullback. A full-scale buyback is anticipated upon any retest of this zone. Both the initial target based on the rounding bottom breakout and the final setup target have been clearly outlined.
We welcome your thoughts and feedback on this current technical outlook.


SUI/USDT: The "Symmetrical Spring" Setup –20% coming📊 Key Levels:
- Resistance Zone:** 3.2$ (Multi-touch rejection)
- Support Zone:** 3$(Psychological + Historical Base)
🎯 Pattern Observed:
Price is compressing like a spring within a **symmetrical triangle** (lower highs + higher lows). The 3.0000 level has held twice, forming a double bottom.
🔥 Creative Twist:
- Volume Clue: Watch for a spike in volume on the breakout—no volume = fakeout.
🎨 Meme-Worthy Hook:
SUI is either loading a rocket or a trapdoor—springs don’t stay coiled forever
📌 Why Share This?
- Visually clean setup (symmetrical patterns attract eyeballs).
- Clear risk/reward (1:3 ratio).
- Adds a narrative (Fibonacci + volume drama).
#SUI #USDT #SymmetricalSpring #BreakoutOrFakeout

SUI SHORTRecently, SUI has failed to break structure and to make a higher yet hence made a lower high and displaced its bullish fvg with a bearish one. Making a footprint which I will utilize. On the graph you can see my entry as well as my target. A untapped 4h OB
Goodluck !
I always appreciate a follow, thanks :)!

SUI LONGCrypto Introduction
Sui is a first-of-its-kind Layer 1 blockchain and smart contract platform designed from the bottom up to make digital asset ownership fast, private, secure, and accessible to everyone. Its object-centric model, based on the Move programming language, enables parallel execution, sub-second finality, and rich on-chain assets. With horizontally scalable processing and storage, Sui supports a wide range of applications with unrivaled speed at low cost. Sui is a step-function advancement in blockchain and a platform on which creators and developers can build amazing, user-friendly experiences.
Entry on 0.5fib, rsi div and trend cont.

Bullish Sentiment on SUIUSDTMy bullish setup is backed by the following confluences:
1) Market Structure(BoS), 2) Liquidity, 3) QM-Orderblock(POI).
To target a 1:2.5rr minimum.
Note: the market is all about probabilities which also makes my analysis a probability.
