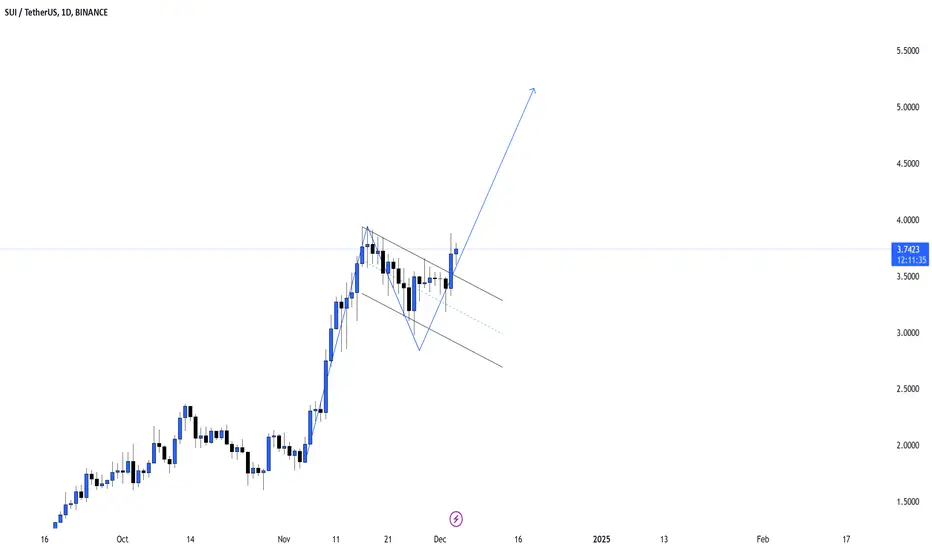
SUI/USDT: Momentum is Building🔥 #SUI/USDT: Momentum is Building! 🔥
CRYPTOCAP:SUI The breakout from the bullish flag formation signals a strong continuation setup. This is an excellent opportunity for traders to capitalize on the momentum as the price gears up for higher levels.
🎯 Targets:
Target 1: $4.9743
Target 2: $5.8885
Target 3: $6.8116
Watch for potential pullbacks as opportunities to enter, and manage your trades with a disciplined approach to stop-loss levels. Let’s aim for the targets together
SUIUSDT.P trade ideas

SUIUSDT.PMEXC:SUIUSDT.P chart already formed a EQL, it should be a inducement on H4, we're looking for a LONG position after it take this EQL.
EN: $3.1129/ 2.9795
SL: 2.8859
TP: 3.9287
RR: 4.6
Confirmation based entry only!


#SUI Cup with handle📊#SUI Cup with handle 📈
🧠From a structural point of view, we have built a bullish cup with handle near the support area, so we may continue to rise according to this structure. The red area is the target area of the long structure in different cycles, so we need to be wary of the selling pressure here.
Let's see👀
🤜If you like my analysis, please like💖 and share💬 BINANCE:SUIUSDT

SUIUSDT FULL TP DONESUIUSDT chart was shared in previous updates. It exactly filled our entry zone and full TP done.

Scalping SUI for Longs!A small scalp of SUI where buy beings now and will cruise to the top as stated

Call #1 SUIUSDT - Soon Breakout from this Zone.Call #1 2nd DEC2024
BINANCE:SUIUSDT - We should soon see a breakout from this zone. Looking very attractive from this point. Going to be a good rally in my opinion from here. All the Best
Entry Zone's $3.30 - $3.39.

$SUI Set for Shallow Retrace – Targeting $15CRYPTOCAP:SUI ( BINANCE:SUIUSDT ) Update:
I’m expecting a retrace on this one. If it starts trading below $2.65, that’s my first level of interest, with a potential drop down to $2.34 if it gets there.
I expect the retrace to be shallow, rather than the usual 50% pullbacks.
Long-term, I’m aiming for double digits, with a target closer to $15.

SUI long scalpdue to SUIs bullish structure im entering off a 30m OB and targeting the next bearish one, this is a scalp so advise to take profits once you feel comfortable. Max tp around 40%roi on 10x lev GL!

SUI wait for entry
SUI has successfully broken the weekly resistance level, and a retest appears highly probable.
Let’s wait patiently for an entry opportunity, expected within the highlighted yellow area on the chart.
Take-profit and stop-loss conditions are also outlined in the chart for reference.
Disclaimer:
This analysis is based on my personnal views and is not a financial advice. Risk is under your control.

SUI / USDT: bouncing back from support and eyeing a breakout abvSUI/USDT: Bouncing Back from Support and Eyeing a Breakout Above Trendline Resistance
SUI/USDT is showing bullish momentum 📈 as it rebounds from a key support zone and approaches a significant trendline resistance 📊. The setup is ripe for a potential breakout 💥 that could trigger a powerful upward rally 🚀. Stay alert and wait for confirmation before taking action.
Key Insights:
1. Support bounce: SUI/USDT has bounced back strongly from a critical support zone, indicating renewed buyer interest and a potential shift in momentum.
2. Trendline resistance: The pair is nearing a long-standing trendline that has capped previous rallies. A break above this resistance could open the doors for a sustained bullish move 🔥.
3. Bullish indicators: Momentum indicators like RSI and MACD are turning positive ⚡, signaling growing strength in the market.
Steps to Confirm the Breakout:
Candle confirmation: Wait for a clear 4H or daily candle close above the trendline 📍.
Volume surge: A noticeable spike in trading volume during the breakout adds confidence to the bullish scenario 📊.
Retest confirmation: Watch for the trendline resistance to flip into a support zone during a successful retest ✅.
Beware of fakeouts: Avoid entering on sharp wicks or sudden reversals above the trendline ⚠️.
Potential Targets (Post-Breakout):
Initial resistance:
Next target:
Risk Management Strategies:
Set stop-loss orders: Protect your capital by placing stop-losses below key levels 🔒.
Position sizing: Ensure your trade size fits your overall risk tolerance and strategy 🎯.
This analysis is for educational purposes only and does not constitute financial advice. Always conduct your own research (DYOR) 🔍 before making investment decisions.

SUI | Sui & Mysten LabThe price of Sui is $1.34 today with a 24hour trading volume of 1 billion dollar, SUI trading on multiple exchanges is live now and the startup has closed its public round recently on KuCoin and OKX
Investors who purchased the native token of the Layer 1 blockchain Sui in a public offering last month are seeing large returns now
Binance accounts for 63% of Sui's spot trading volume, Bybit 16.6%, OKX 10.6%, and KuCoin 7.3%
Sui is a layer one blockchain and smart contract platform designed from the bottom up to make digital asset ownership fast, private, secure, and accessible to everyone. Its object centric model, based on the Move programming language, enables parallel execution, sub-second finality, and rich on-chain assets. With horizontally scalable processing and storage, Sui supports a wide range of applications with unrivaled speed at low cost. Sui is a step-function advancement in blockchain and a platform on which creators and developers can build amazing, user-friendly experiences.
Mysten Labs, the original contributor to Sui, was founded by by former executives & lead architects of Meta’s Novi Research
the team responsible for Diem blockchain and Move programming language: Evan Cheng, Adeniyi Abiodun, Sam Blackshear, George Danezis...
Sui listings that came in the evening on a day when the FED's interest rate decision may have put pressure on the price so no fomo
it is necessary to wait for the price to accumulate in a certain range and not to act for fear of losing the opportunity

SUI to 24$My research indicates that SUI is a project with a great potential, and could get into the top 10 cryptocurrencies by market cap soon.
I don't encourage you to but by any means, do your own research.

SUIUSDT - ThoughtsI expect more movement for the bulls potentially even breaking this upper green solid line.
Reaching close to $10 this alt looks good.
I expect this run to move up % wise a lot more than the first move in Oct 2023.
Daily chart.

SUI LONG OPPURTUNITY - SUI NETWORK BULLISH TREND ALERTSUI is one of the most popular altcoins in the crypto market right now. It has strong fundamentals, a solid team, and a growing community. I personally hold a spot position in this coin, and I expect to see SUI among the top 10 most valuable crypto assets soon.
Technical Analysis: SUI ran the daily swing liquidity and reached the daily demand zone responsible for the previous all-time highs. The price couldn't close below the daily swing and showed a strong rejection there.
After that, SUI broke the diagonal trendline that had maintained the lower time-frame bearish trend. The breakout was strong, with a close above, indicating to me that SUI has broken the bearish lower time-frame structure and is now targeting new highs.
I expect a small retracement to the green zone marked as the "4H Demand Zone," aligning with the Fibonacci equilibrium level. I’ll be looking to open a position there, aiming for new all-time highs.

SUIUSDT: A Comprehensive Technical Breakdown - Sui◳◱ On the $SUI/ CRYPTOCAP:USDT chart, the Trend Reversal pattern suggests indications that the trend may be gaining or losing strength. Traders might observe resistance around 3.8248 | 4.2539 | 5.027 and support near 3.0517 | 2.7077 | 1.9346. Entering trades at 3.4683 could be strategic, aiming for the next resistance level.
◰◲ General info :
▣ Name: Sui
▣ Rank: 23
▣ Exchanges: Binance, Kucoin, Huobipro, Gateio, Mexc, Hitbtc
▣ Category/Sector: N/A
▣ Overview: Sui project overview is currently unavailable. I'll try to update this in the upcoming analysis.
◰◲ Technical Metrics :
▣ Mrkt Price: 3.4683 ₮
▣ 24HVol: 279,314,258.243 ₮
▣ 24H Chng: 1.68%
▣ 7-Days Chng: -2.94%
▣ 1-Month Chng: 111.44%
▣ 3-Months Chng: 341.99%
◲◰ Pivot Points - Levels :
◥ Resistance: 3.8248 | 4.2539 | 5.027
◢ Support: 3.0517 | 2.7077 | 1.9346
◱◳ Indicators recommendation :
▣ Oscillators: BUY
▣ Moving Averages: STRONG_BUY
◰◲ Technical Indicators Summary : BUY
◲◰ Sharpe Ratios :
▣ Last 30D: 6.93
▣ Last 90D: 5.71
▣ Last 1-Y: 1.98
▣ Last 3-Y: 1.02
◲◰ Volatility :
▣ Last 30D: 1.26
▣ Last 90D: 1.12
▣ Last 1-Y: 1.19
▣ Last 3-Y: 1.09
◳◰ Market Sentiment Index :
▣ News sentiment score is N/A
▣ Twitter sentiment score is N/A
▣ Reddit sentiment score is N/A
▣ In-depth SUIUSDT technical analysis on Tradingview TA page
▣ What do you think of this analysis? Share your insights and let's discuss in the comments below. Your like, follow and support would be greatly appreciated!
◲ Disclaimer
Please note that the information and publications provided are for informational purposes only and should not be construed as financial, investment, trading, or any other type of advice or recommendation. We encourage you to conduct your own research and consult with a qualified professional before making any financial decisions. The use of the information provided is solely at your own risk.
▣ Welcome to the home of charting big: TradingView
Benefit from a ton of financial analysis features, instruments and data. Have a look around, and if you do choose to go with an upgraded plan, you'll get up to $30.
Discover it here - affiliate link -

SUI - Great bounce from 0.75 fib levelSUI follwing the plan. Small pullback was expected. Now gearing up for next leg. SUI/USDT

SUIUSDTmy entry on this trade idea is taken from a point of interest BELOW an inducement.. I extended my stoploss area to cover for the whole swing as price can target the liquidity there before going as i anticipate.. just a trade idea, not financial advise

SUIUSDT potential Up trend continuationSUIUSDT recently pulled back to the support level at $3.00, taking liquidity below last week's low. The market formed a descending triangle pattern, characterized by lower highs, indicating a price squeeze. A descending triangle is typically a bearish pattern that anticipates a downward trend breakout.
However, the market has broken above the downward trendline, suggesting a potential bullish reversal. If the price closes above this trendline, it may continue moving higher, following a contraction-expansion price action pattern. The target is the resistance zone around $3.83

Lingrid | SUIUSDT contraction EXPANSION pattern. LongBYBIT:SUIUSDT pulled back to the support level at 3.00, then bounced back by taking liquidity below last week's low. Additionally, the market formed a descending triangle pattern characterized by lower highs, indicating a price squeeze. Recently, the market broke the downward trendline, and I believe the price may rise further if it closes above this trendline. I expect the price to continue moving higher, as we are seeing a contraction-expansion price action pattern. My goal is resistance zone around 3.8300
Traders, if you liked this idea or if you have your own opinion about it, write in the comments. I will be glad 👩💻

Massive Move Ahead? SUI Hourly Chart Signals Big Opportunities!BINANCE:SUIUSDT is currently experiencing a phase of consolidation, as highlighted in a recent 1-hour technical analysis. The pair is nearing critical resistance and support levels, which could lead to potential breakouts or rebounds soon. Key resistance points are set at $3.3958, $3.4193, and $3.4221, while support levels are identified at $3.2894, $3.2621, and $3.2462.
The analysis indicates that short-term price movements are under minor bearish pressure, remaining below the 9 EMA. However, the proximity of the 9 EMA to the 20 EMA suggests a possible reversal if resistance levels are breached. A close above $3.3958 could pave the way for further upward movement.
Mixed momentum signals are evident in the MACD and RSI indicators. The MACD histogram has shifted from bullish to bearish, indicating weakening momentum, while the RSI hovers around neutral territory. A return to positive MACD territory could support a bullish outlook, whereas sustained bearish momentum may test lower support levels.
For traders, entering long positions upon a confirmed breakout above $3.3958 could be strategic, with profit targets at $3.4193 and $3.4221. Conversely, short positions may be considered if the price fails to break resistance, with potential exit points near $3.2621 or $3.2462.

