3.7 RR going with the trendIt is possible the trend has completed, however SUI has not yet hit its daily target. Thus we can try to rebuy the retest near the trend line. The lower white line is the 'proper' entry, however trade may be missed, so I will enter on the red.
SUIUSDT.P trade ideas

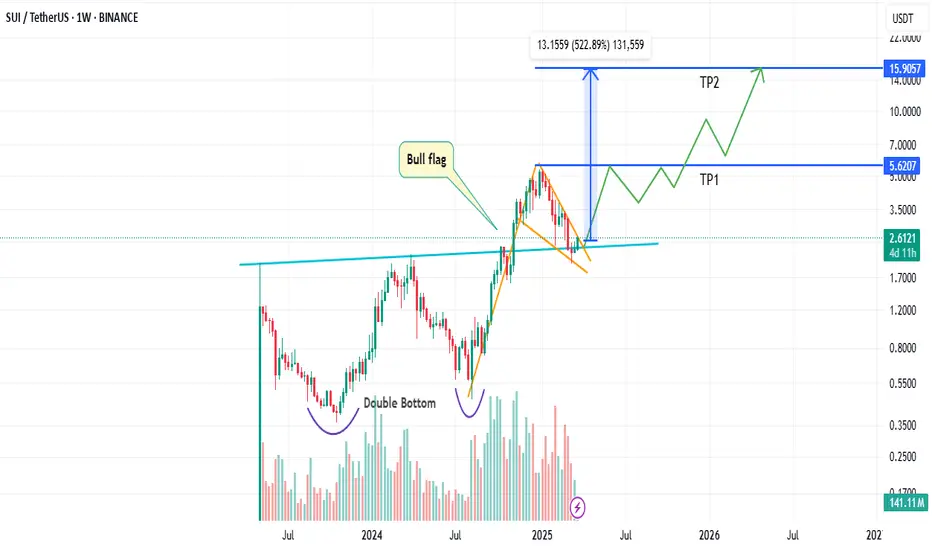
From $5 to $16 ? The SUI Setup You Need to See !Hello Traders 🐺
These days, everyone is talking about SUI—a U.S.-based cryptocurrency that’s showing serious potential to become one of the top gainers in the upcoming Altcoin Season. Let me break it down for you 👇
📈 Chart Analysis
On the chart, we can clearly see a Double Bottom formation, which led to a breakout and a rally to a new ATH at $5.62. After reaching that level, SUI pulled back to retest the previous resistance—which has now flipped into support. ✅
📉 What Now?
Currently, SUI is trading inside a falling wedge pattern, which in my opinion has great potential to act as a bull flag. Depending on how we interpret the pattern, price targets can vary—but don’t worry, I’ve simplified it for you:
🎯 Price Targets
1️⃣ First Target → Top of the falling wedge at $5.62 (ATH)
2️⃣ Second Target → Around $16 🚀
Make sure to take partial profits along the way and manage your risk properly.
Thanks for reading my idea—I hope you found it helpful! 🙌 Don’t forget to like and follow for more updates and support. And always remember:
🐺 Discipline is rarely enjoyable, but almost always profitable 🐺
🐺 KIU_COIN 🐺
SUI Possible New ATH, AgainLooking at the Oscillator's curves I circled, that means the current CRYPTOCAP:SUI Price Action is oversold.
we are very close to Alt seasons, indicated by CRYPTOCAP:ETH rally. So, there's a big chance that smart moneys will start to accumulate the big caps of alt coins.
Well, SUI is one of the best alt coins out there.
My personal target
TP 1 $5
TP 2 $10
Friendly reminder, I don't set stop losses as I'm not doing derivatives market
Alt seasons is coming very soon, do not lose your money by speculating low to no market caps coins! it's always a great choice to bet on bluechips and large caps

SUI/USDTHello friends
You can see that after the price fell in the specified support area, the price was supported by buyers and caused the resistance to break, and now, when the price returns to the specified ranges, you can buy in steps and move with it to the specified targets, of course, with capital and risk management...
*Trade safely with us*

SUI: Scaling Blockchain with High PerformanceDescription:
This trading idea focuses on SUI, a next-generation Layer 1 blockchain designed for high scalability, low latency, and enhanced security. Developed by former Meta engineers, SUI leverages the Move programming language to optimize smart contracts and improve transaction efficiency. Its innovative architecture enables parallel execution, reducing network congestion and enhancing speed, making it a strong competitor in the blockchain space. As demand for scalable and cost-effective blockchain solutions grows, SUI is positioned to attract developers, enterprises, and DeFi projects seeking a more efficient infrastructure.
Despite its strong fundamentals, the cryptocurrency market remains highly volatile, influenced by regulatory developments, macroeconomic factors, and overall market sentiment. Therefore, investing in SUI carries inherent risks, and traders should implement proper risk management strategies.
Disclaimer:
This trading idea is for educational purposes only and should not be considered financial advice. Cryptocurrencies like SUI are highly speculative and subject to rapid price fluctuations, which can result in the complete loss of capital. Always conduct thorough research, assess your financial situation, and consult with a financial advisor before making investment decisions. Past performance is not indicative of future results.

SUI - Last Growth Ahead Before Bear MarketHello, Skyrexians!
It's time to update BINANCE:SUIUSDT idea. Last time we pointed out that wave 3 has been finished and correction incoming. Now we are seeing this correction. Today we got the indicating that correction is over and we can see the great growth soon.
Let's look at the weekly chart. Here we can see the Elliott waves structure. Wave 3 has been finished at the recent top. Awesome oscillator gives us the hint that bull run will continue, but now that much because we have only wave 5 ahead which has a target $5-7 in the next 3-6 months. The strong confirmation that correction is over is the green dot on the Bullish/Bearish Reversal Bar Indicator below the alligator's lines.
Best regards,
Skyrexio Team
___________________________________________________________
Please, boost this article and subscribe our page if you like analysis!

SUI Update | BTC | ETH | XRPOur stoploss from last trade still not hit and SUI after selloff breaking minor consolidation.
if it holds here and SUIBTC bounce at 50MA Weekly. we can see some good run.

SUI/USDT Short🧠 Overview
Market: SUI/USDT
Timeframe: 4H
Bias: Bearish
Structure Type: Internal Market Structure Shift (iMS), Internal Break of Structure (iBOS)
Trade Type: Trend Continuation after Failed Bullish Breakout
Tool Set: Structure Zones, iBOS Labels, Trendlines, Wave Momentum Indicator, EMAs
🧱 Context Building: Market Structure Analysis
The 4H chart on SUI/USDT provides a textbook case of a swing market structure breakdown following a false breakout attempt.
✅ What We Observed:
Bullish internal market structure (iMS) led to multiple internal breaks of structure (iBOS), confirming higher lows and building bullish momentum.
Price consolidated between the ascending support line and horizontal resistance around $2.35.
Despite two clean iBOS, the price failed to break the swing high—a signal of internal bullish weakness.
🔻 Confirmation: Bearish Shift in Structure
Key Confirmation Events:
Break of Ascending Trendline
Price decisively broke below the ascending diagonal trendline, invalidating bullish continuation.
Internal Lower High Forms
A new lower high formed after failing to clear $2.35, which confirmed the start of a bearish internal trend.
Momentum Oscillator Flips Bearish
Using a wave-style oscillator, we observe:
Red dots appearing on top of momentum waves.
Decreasing money flow index (flowing toward zero or negative).
Bearish divergence relative to previous highs.
EMA Rejection
Price is trading below a fast EMA (likely 9 or 21 EMA), and the moving average has begun to curl downward, further confirming a momentum shift.
🎯 Trade Execution
🛑 Entry Trigger
Entry: On confirmed break and close below trendline and support at $2.30.
Confirmation: Momentum oscillator showing bearish crossover and price retesting structure as resistance.
🧷 Stop Loss Placement
Stop Loss: Placed just above the lower high around $2.35–$2.37.
This invalidates the trade if price reclaims bullish territory.
📉 Target Zones
TP1: $2.00 psychological round number.
TP2: $1.94 – previous structural support / weekly level.
TP3 (optional): Trail further if breakdown accelerates with strong volume.
🪙 Risk-Reward Profile
Entry Stop Loss TP1 TP2 R:R Estimate
$2.28 $2.36 $2.00 $1.94 ~2.5 - 3.0x
The trade offers an excellent R:R ratio when executed after trendline break and bearish momentum alignment.
🔄 Trade Management
After Entry: Monitor price reaction at $2.24 zone. If price bounces hard and reclaims the broken trendline, consider partial exit or move SL to breakeven.
If TP1 is hit: Move stop to breakeven, secure profits, and let the rest run to TP2.
Exit Full Trade: If bullish structure begins forming with an iBOS above $2.35.
🔎 Lessons & Takeaways
Structure Breaks Matter More Than Candle Patterns: The loss of structure support carried more weight than bullish candle wicks or oversold indicators.
Internal Structure Gives Early Signal: The iBOS and lower highs signaled the reversal before the BOS occurred.
Confluence is King: Combining market structure, trendlines, and momentum indicators gives confidence in bias.
🧭 Final Thoughts
This SUI/USDT trade is a high-probability example of trading against weak highs from internal structure after a failed breakout. By reading market structure correctly and executing with discipline, this setup aligns well with smart money principles and can be consistently repeatable across assets and timeframes.

SUI Weekly Chart Analysis CRYPTOCAP:SUI Weekly Analysis
#SUI is showing a potential trend reversal after a deep retracement from its previous highs. Currently, the price is holding above a major support zone, which previously acted as resistance — now flipping into support 🧠
We can spot a falling wedge breakout pattern forming, which is typically bullish 📊
If momentum continues to build, here are the target levels to watch:
🎯 Target 1: $3.5
🎯 Target 2: $4.5
🎯 Target 2: $6
@Whalesdesk

SUIUSDT 5DSUI ~ 5D Analysis
#SUI Buy and hold, coin blue chip that might be included in the Top 10 Marketcap list.
Target $10 ++

SUI SHORTA 1 hour trend break on SUI, as well as filled the weekly bearish gap and with good strength and volume bounced off bearish OB. Aiming at lower LQ and weekly lows.
GOODLUCK !

SUI/USDTSUI is now locally showing accumulation on the 4hr chart and has just confirmed 2.37 as support and is now actionable for a good R:R long position.
Trade safely.

SUIUSDT: Breakout + Retest = Lift-Off Soon!BINANCE:SUIUSDT has shown impressive strength, bouncing back with solid volume after hitting a major weekly support level. This bullish reaction suggests a potential move toward higher highs, making it an attractive opportunity for long-term investors. Entering a position in the spot market and holding for the long term could yield significant gains.
On the 4-hour chart, SUI is forming an ascending triangle pattern. After breaking out, it has successfully retraced and is now gearing up for a strong swing move. Traders can consider entering at this level and look to book profits as the price climbs higher. As always, managing risk with a proper stop loss is crucial.
BINANCE:SUIUSDT Currently trading at $2.4
Buy level : Above $2.4
Stop loss : Below $2.15
Target : $3.5
Max leverage 3x
Always keep stop loss
Follow Our Tradingview Account for More Technical Analysis Updates, | Like, Share and Comment Your thoughts

SUI DistributionThe model 2 on SUI i posted on Tuesday turned into an possible model 1. A breakdown from this area would confirm it, but i would look at what BTC is doing and the upcoming weekend range.

SUI/USDT 4H ANALYSISHello friends today we are going to analyze SUI/UST in 4H time frame as one of our viewers on YouTube asked for it. I forgot to to include it in that video but here on trading View we are going to analyze it.
As we see that we have a key support level at $2.08 and also we have a strong 4 hours resistance trend line that for it to retain its bullish momentum it needs to close or make a higher high in 4H over the resistant trend line.
Also as marked on the chart we have a key resistance area at $3.6 which is a key level for retaining its bullish momentum.

SUI - A New TAOI rises but CVD is decreasing!
1h and 2h OBV looks a little bit different! not that clear where are we going.
Depends on USDT.D and BTC.D
Daily and VAH is broken.
Marked yellow level could be a nice short.
Eyes on it ...
Follow for more ideas/Signals. 💲
Look at my other ideas 😉
Just donate some of your profit to Animal rights and rescue or other charity :)✌️

SUI/USDT 1H: Bullish Breakout Confirmed – Can $2.65 Be ReachedSUI/USDT 1H: Bullish Breakout Confirmed – Can $2.65 Be Reached?
Current Market Conditions (Confidence: 8/10):
Price at $2.40, showing a strong breakout from the accumulation zone.
RSI at 60.41, indicating bullish momentum with room to run higher.
Clean break above $2.35 resistance with strong volume confirms bullish intent.
Hidden bullish divergence forming on RSI, reinforcing continuation potential.
LONG Trade Setup:
Entry: $2.38 - $2.42 zone.
Targets:
T1: $2.50 (first resistance).
T2: $2.65 (major liquidity zone).
Stop Loss: $2.30 (below recent support).
Risk Score:
7/10 – Favorable risk-to-reward, but watch for temporary resistance at $2.50.
Market Maker Activity:
Accumulation is evident with minimal selling pressure above $2.35.
The clean break of resistance suggests a continuation of the uptrend.
Strong support is established at $2.30, with clear order blocks reinforcing demand.
Bull flag pattern forming, signaling an imminent move higher.
Recommendation:
Long positions remain favorable in the $2.38 - $2.42 range.
Monitor price action at $2.50, as this level may provide temporary resistance.
If volume continues to increase, expect a move toward $2.65.
🚀 Follow me on TradingView if you respect our charts! 📈 Daily updates!

SUIUSDTmy entry on this trade idea is taken from a point of interest below an inducement (X).. I extended my stoploss area to cover for the whole swing as price can target the liquidity there before going as I anticipate.. just a trade idea, not financial advise
Entry; $3.1090
Take Profit; $5.5823
Stop Loss; $2.3363

SUI/USDTHello friends
Given that the price has reached a good support and buyers have entered and supported the price, you can now buy in stages at the specified levels with capital and risk management and move towards the specified goals.
If you would like to be with us in the Alt Season, send us a message.
*Trade safely with us*

Buying SUI at $2.30 | BTC | ETH | XRP |Trade Update – SUI: SUI is currently testing a major support zone around its 50-week moving average and the previous high, making it a key level to watch.
A bounce from here could signal strong upside potential.
Entering a buy position at this level with a stop-loss at 2.20 to manage risk effectively.
A breakout above resistance could lead to further gains. 📈

$SUI/USDT Trading IdeaSUI is setting up for a clean move, just needs to flip that resistance and break above the 50 & 200 EMA. Falling wedge formation? High probability of retesting that yellow premium zone on the daily? Now it’s just a waiting game. Let’s see if it delivers.

SUI: Current SituationYou asked, and we delivered:
SUI is trading at $2.2616, navigating a volatile crypto market that’s down 4.4% in total market cap over the last 24 hours. As a Layer 1 blockchain, SUI stands out with its object-centric data model and Move programming language, emphasizing scalability and user accessibility. Its token serves multiple roles: staking, gas fees, utility, and governance. With a market cap of $7.51 billion and a circulating supply of 3.17 billion SUI (out of 10 billion), SUI ranks between #19 and #23 among cryptocurrencies. Recent trading volume is robust, ranging from $578.34 million to $742.90 million in 24 hours, signaling strong market activity. The price is well below its all-time high of $5.35 (January 4, 2025), with recent lows at $2.01 and highs at $2.42. Sentiment is mixed: some traders eye a breakout from a descending channel and partnerships as bullish, while others flag bearish divergence and a broken macro structure, hinting at downside risks to $1.30-$0.95.
Technical Indicators and Key Levels
Short-Term (1-Hour and Daily Charts):
Support: $2.20 (immediate), $2.01 (cycle low)
Resistance: $2.38 (24-hour high), $2.42 (cycle high), $2.50
Indicators: RSI ~50 (neutral), MACD bearish but hinting at reversal. A hold above $2.20 could spark a rally to $2.38-$2.50.
Long-Term (Weekly Chart):
Support: $2.00, $1.30-$0.95
Resistance: $2.50, $3.00, $5.35 (ATH)
The 200-day MA is falling, reflecting long-term pressure, but holding $2.00 is key for bulls.
Potential Scenarios
Bullish Case: Hold $2.20, break $2.38 with volume → target $2.42-$2.50 (short-term), $3.00 (long-term).
Bearish Case: Drop below $2.20 → test $2.01; below $2.00 risks $1.30-$0.95.
Volume is critical—watch for spikes to confirm moves.
Broader Context and Tips
SUI’s fundamentals, scalability, user-friendly features like zkLogin, and ecosystem growth, offer long-term promise, but short-term risks loom. External factors like regulatory shifts or macro events (e.g., US inflation data) could sway its path. Traders should focus on $2.20, a hold keeps bulls in play, a break signals caution. Use tight stops (e.g., below $2.20 for longs) and stay alert for news on partnerships or adoption. Long-term, $2.00 is a key floor for accumulation.

BULLISH SCENARIOI'm seeing an ABCD Bullish Harmonic Pattern for SUI. I'm expecting more drop for SUI below $1. Congratulations those who are in short :)
