SUIUSDT: Bullish Breakout from Rounding Bottom FormationSUIUSDT presents a rounding bottom formation, with price action successfully breaking and closing above the neckline resistance, confirming a strong bullish continuation signal. The immediate plan is to monitor the defined Buy Back Zone for potential re-accumulation opportunities should price retrace.
The neckline region, now converted into a key demand area, is expected to act as major support in case of any pullback. A full-scale buyback is anticipated upon any retest of this zone. Both the initial target based on the rounding bottom breakout and the final setup target have been clearly outlined.
We welcome your thoughts and feedback on this current technical outlook.
SUIUSDT.PS trade ideas

SUI’s Rigorous Pump Ahead or Just Ditching1. Breakout from a Prolonged Downtrend Channel
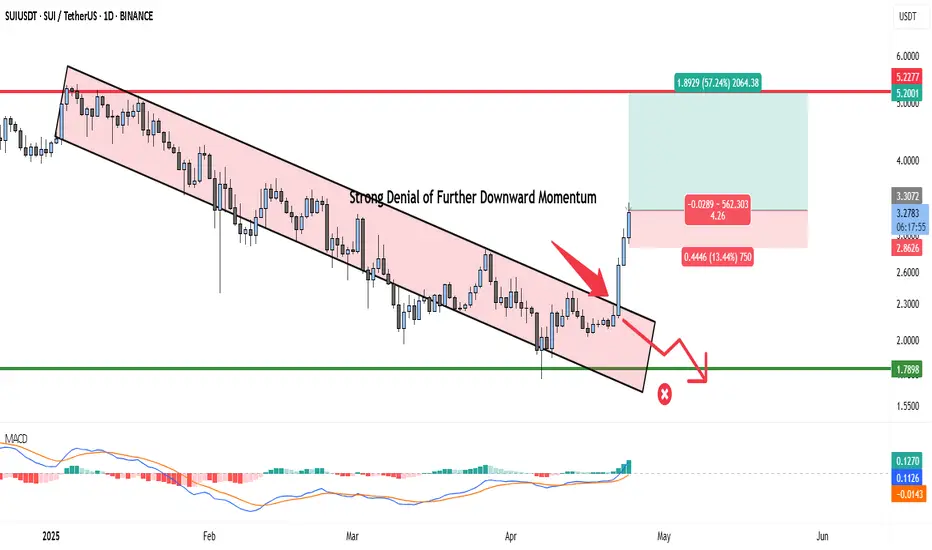
For months, SUI had been trapped within a descending parallel channel, consistently making lower highs and lower lows — a clear bearish structure. However, a recent strong bullish breakout has completely invalidated this downtrend.
A large, convincing candlestick broke above the channel resistance with high volume, signaling a clear rejection of continued bearish pressure. This move represents a strong denial of further downward momentum, as highlighted in the chart by the red arrows.
The red arrows do not imply a bearish continuation — they emphasize how the price refused to stay within the bearish zone and instead broke out aggressively, flipping sentiment bullish.
2. MACD Momentum Confirmation
Below the price action, the MACD indicator shows a bullish crossover with growing histogram bars. This aligns perfectly with the breakout and indicates that momentum is gaining strength on the upside. The MACD line has crossed above the signal line and moved into positive territory, providing strong confirmation for a bullish move.
3. Bullish Trade Setup (As Highlighted on Chart)
Entry: $3.2970
Stop Loss: $2.8626 (placed below previous consolidation/breakout area)
Take Profit: $5.200
This setup yields an attractive Risk-Reward Ratio of 4.26, with a potential gain of 57.24% from the entry point. The green target area above suggests a price recovery back toward major resistance levels not seen since the earlier rally.
A clean break and hold above this zone may open the doors for a trend reversal toward the $5+ range.
4. Support Zone to Watch
Should the price ever pull back, the $1.7898 level remains a historically significant support zone — though the current structure shows no signs of testing that level again, at least in the short term.
Fundamental Analysis of SUI
SUI is a high-performance Layer 1 blockchain developed by Mysten Labs, leveraging the Move language for smart contract safety and speed. The platform focuses on supporting Web3 scalability, particularly for games and interactive applications.
Recent Bullish Catalysts
New ecosystem integrations and developer grants have drawn attention to the platform.
Expanding support across top-tier exchanges (e.g., Binance, Coinbase) has enhanced liquidity.
Growing adoption in Web3 gaming and DeFi dApps built on SUI has positioned it as a next-gen smart contract chain.
Final Take
The breakout from the descending channel, supported by MACD momentum and a defined long trade setup, gives SUI a strong technical outlook. The red arrows signify how bears were rejected at the breakout, not a suggestion of a pullback. Combined with strong fundamentals and increased adoption, SUI is currently favoring bulls in both the short and medium term.
Bull Bias Confirmed
Eyes on $5.200
Manage risk at $2.8626
SUI whats the target ?SUI / USDT
SUI is just following my scenario 2 in previous analysis.. click here
What next ? :
With current big price surge we are looking for previous ATH , after that the main resistances are: 7$ and 9$/10$
They are considered very strong resistance but if the price could overcome them we will see SUI flying like never before
Always do risk management
Make your plan and dont FOMO
Best of wishes

$SUI has nearly completed its correction — get ready!🚀 CRYPTOCAP:SUI has nearly completed its correction — get ready for a potential breakout in 4 weeks!
After an explosive push upward, a massive bearish divergence has formed — but the next leg could be just around the corner.
📊 Key signals:
MACD (1W) is about to flip bullish — a crossover expected in ~4 weeks.
RSI is near its previous bottom, signaling potential for a rebound.
Volume is matching levels seen during the last major rally.
📅 All signs point to May 19, 2025.
This could be the turning point.
CRYPTOCAP:SUI is in my buy zone at the moment (the green rectangle).
I project a new all time high.
📌 Stay sharp. Be prepared.
🧠 DYOR (Do Your Own Research)
#SUI #Altcoins #CryptoSignals #MACD #RSI #CryptoUpdate #May2025 #SUIUSDT #BullishSetup #DYOR

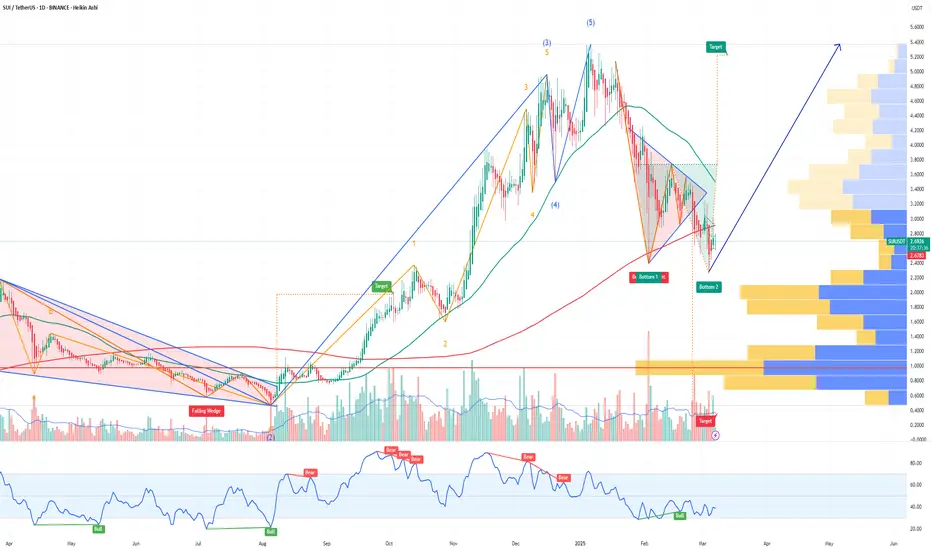
SUI Is Entering Into Final Stage Of Bull MarketHello, Skyrexians!
On yesterday's crypto pump BINANCE:SUIUSDT was the greatest performer and people started to have an interest in this coin will continue growing or this is just a bull trap. Let's try to understand it.
On the 1W time frame we have unclear, but Elliott wave structure. It looks like wave 4 overlapped with the wave 1. You will tell me that it's impossible. In practice it can happen especially on altcoins. According to the Awesome Oscillator wave 4 is finished which can be also confirmed by our Bullish/Bearish Reversal Bar Indicator . The final wave 5 will reach the green box, to have the more accurate target we need to count waves inside wave 5.
Best regards,
Skyrexio Team
___________________________________________________________
Please, boost this article and subscribe our page if you like analysis!

#SUIUSDT: Will Bulls Continue The Move Upwards of $8?The price of BINANCE:SUIUSDT has been bullish since completing its accumulation phase and is currently in the distribution phase. It has shown a strong change of character, with a steady move. However, a short-term correction is expected to fill the gap that the price has left behind.
In a bullish scenario, prices often continue their upward trend without making corrections, and this could be the case with this crypto pair as well. At the moment, we recommend monitoring the price momentum and entering trades according to your trading plan.
We have set three targets based on your bias, but please note that these are not a confirmation of buy or sell. They are simply our overview of the trade and are limited to the knowledge and experience of our traders.
Wishing you good luck and safe trading!
Thank you for your unwavering support! 😊
If you’d like to contribute, here are a few ways you can help us:
- Like our ideas
- Comment on our ideas
- Share our ideas
Team Setupsfx_
❤️🚀

SUI SHORT massive manipulation on binance perps.I expect the market maker's volume output and the price to float freely, through spot fixation by big hands, May 1st major unlocking of SUI tokens, 60+% of tokens are in the block,
I keep shorting from 2.60 with targets on the chart, personally I see in this impulse we got a soon continuation of the downward structure with a local break renewal, too much positive from nothing, duties + tense situation in Asia can give impetus to a quick price delivery to 2.85 level

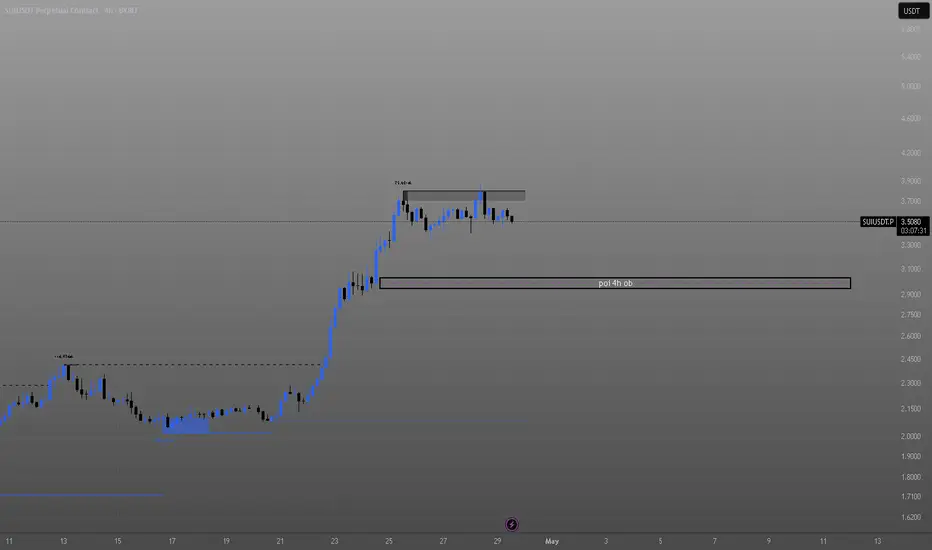
SUISUI has been ranging for a quite a while and I am now looking for a sweep of swing lows and a tap of the 4h ob as seen on the chart. I will wait for a valid confirmation before entering with leverage although im putting a risk entry on the equilibrium of the OB
Bullish Sentiment on SUIUSDTMy bullish setup is backed by the following confluences:
1) Market Structure(BoS), 2) Liquidity, 3) QM-Orderblock(POI).
To target a 1:2.5rr minimum.
Note: the market is all about probabilities which also makes my analysis a probability.

SUI/USDT.P Short Setup — Ride the Wave to Profits!Trade Details:
Entry: 3.56 - 3.6 USDT
Stop-Loss: 3.6935 USDT
Take-Profit Levels:
TP1: 3.4215 USDT
TP2: 3.2700 USDT
TP3: 3.0640 USDT
With clear targets set and a tight risk management strategy, this setup offers a great opportunity to ride the wave of the market’s next move.
Patience and discipline are key. Stay focused, follow your plan, and let's make this trade count!


SUI at its best!SUI has shown exceptional gains over the past few days. The back-to-back green candles look amazing for traders. With the price currently at $3.5, SUI is testing a key resistance level that it’s trying hard to break.
Looking at the RSI, SUI has entered the overbought zone, so a retest toward the $2.7–$3 range is likely. In the long run, the ultimate target for SUI remains at $5.
Note: Always do your own research and analysis before investing.

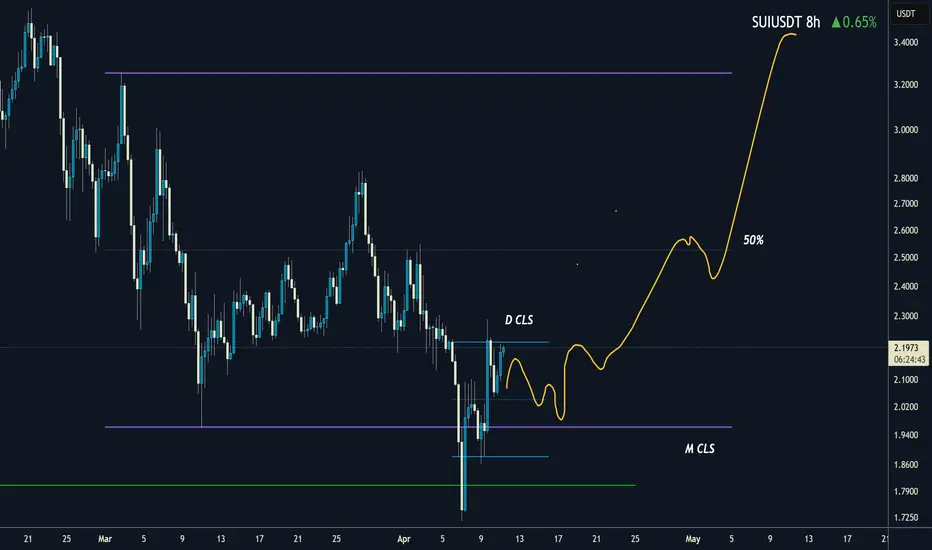
SUI I Monthly CLS I KL - OB I Model 1 I TP1 50% then openHey, Market Warriors, here is another outlook on this instrument
If you’ve been following me, you already know every setup you see is built around a CLS range, a Key Level, Liquidity and a specific execution model.
If you haven't followed me yet, start now.
My trading system is completely mechanical — designed to remove emotions, opinions, and impulsive decisions. No messy diagonal lines. No random drawings. Just clarity, structure, and execution.
🧩 What is CLS?
CLS is real smart money — the combined power of major investment banks and central banks moving over 6.5 trillion dollars a day. Understanding their operations is key to markets.
✅ Understanding the behaviour of CLS allows you to position yourself with the giants during the market manipulations — leading to buying lows and selling highs - cleaner entries, clearer exits, and consistent profits.
🛡️ Models 1 and 2:
From my posts, you can learn two core execution models.
They are the backbone of how I trade and how my students are trained.
📍 Model 1
is right after the manipulation of the CLS candle when CIOD occurs, and we are targeting 50% of the CLS range. H4 CLS ranges supported by HTF go straight to the opposing range.
📍 Model 2
occurs in the specific market sequence when CLS smart money needs to re-accumulate more positions, and we are looking to find a key level around 61.8 fib retracement and target the opposing side of the range.
👍 Hit like if you find this analysis helpful, and don't hesitate to comment with your opinions, charts or any questions.
⚔️ Listen Carefully:
Analysis is not trading. Right now, this platform is full of gurus" trying to sell you dreams based on analysis with arrows while they don't even have the skill to trade themselves.
If you’re ever thinking about buying a Trading Course or Signals from anyone. Always demand a verified track record. It takes less than five minutes to connect 3rd third-party verification tool and link to the widget to his signature.
"Adapt what is useful, reject what is useless, and add what is specifically your own."
— David Perk aka Dave FX Hunter ⚔️
SUI/USDT 26/04/2025 Analyzing trade!Hello guys this is my analysis on SUI/USDT I took a short breakout trade from the old range

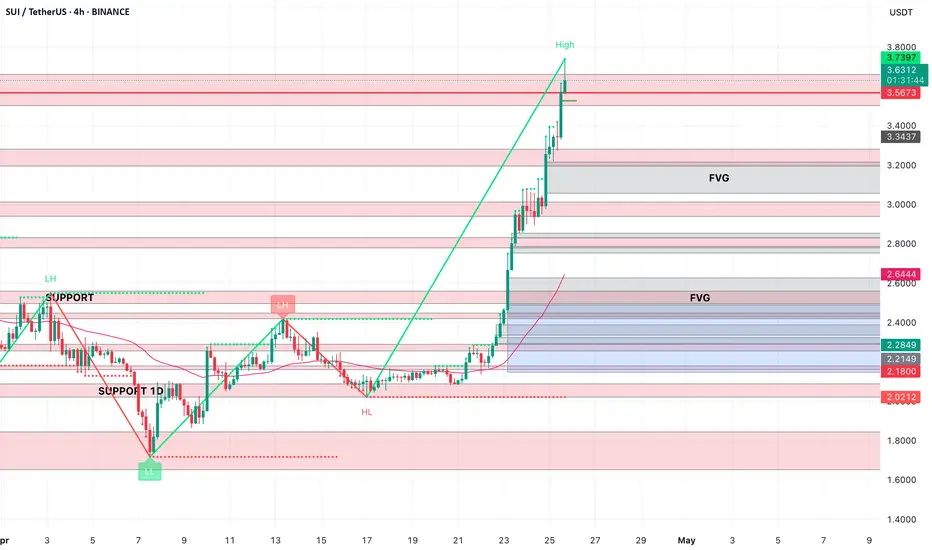
SUI AnalysisSUI/USDT - 4-Hour Chart Analysis: Potential Bullish Continuation
This analysis focuses on the 4-hour chart of SUI/USDT on Binance. Key observations include:
Current Price: SUI is trading at $3.6423, up 1.95% from the previous close.
Recent High: The recent high is $3.7397.
Support Levels: Key support levels are identified at $2.12 and $1.80. There's also a support zone labeled "SUPPORT 1D."
Fair Value Gap (FVG): There are two Fair Value Gaps (FVG) marked on the chart, one above the current price and one below, which could act as potential areas of interest.
Potential Bullish Trend: The chart suggests a potential continuation of the bullish trend, with the price moving upwards from the support levels.
Disclaimer: This is not financial advice. Please do your own research before making any trading decisions.
Inverted Head and Shoulders Pattern🚨 SUI Forming Bullish Inverted Head and Shoulders Pattern 🚨
SUI appears to be forming a bullish inverted head and shoulders pattern. For confirmation of this bullish pattern, the price needs to break out above the neckline, which is marked in red.
📈 Technical Overview:
Pattern: Bullish Inverted Head and Shoulders
Neckline: Red resistance level
Confirmation: A breakout above the red neckline will confirm the bullish pattern.
🎯 Potential Move: Bullish continuation upon confirmation of the breakout.

Trump's World Liberty Financial to add SUI to strategic reserve!CRYPTOCAP:SUI , a leading Layer-1 blockchain, has entered into a significant partnership with World Liberty Financial (WLFI), a decentralized finance (DeFi) platform affiliated with Donald Trump.
This collaboration involves integrating Sui's native token (SUI) into WLFI's "Macro Strategy" reserve, a strategic token fund designed to diversify holdings and support emerging blockchain projects.
The partnership also aims to explore product development opportunities leveraging Sui's technology.
WLFI's Macro Strategy reserve already includes prominent digital assets such as Bitcoin, Ethereum, and tokenized real-world assets like U.S. Treasury-backed tokens.
The addition of SUI reflects WLFI's focus on supporting innovative blockchain projects while expanding decentralized finance access to a broader audience.
The announcement of this partnership coincides with broader developments in the U.S. crypto landscape.
President Trump is expected to unveil details about a proposed "Crypto Strategic Reserve" during the White House Crypto Summit on March 7, 2025.
This reserve is anticipated to focus primarily on Bitcoin while also considering other digital assets
Trump-backed World Liberty Financial plans to add SUI to its strategic reserve.
I think the upside for SUI is Huge from here!
SUI LONG Here we have a clear breakout post monthly and daily breakout. Perfect Entry with targets at $9-$10. Guys... Get in while you can!

SUI Long in WIDEA for SUI in Weekly time frame:
-Analysis used: Elliot waves + Fibonacci + Ascending Channel
-Long in wave 2 retracement for a 2-3 month projection

#SUI/USDT#SUI
The price is moving within a descending channel on the 1-hour frame and is expected to break and continue upward.
We have a trend to stabilize above the 100 moving average once again.
We have a downtrend on the RSI indicator that supports the upward move with a breakout.
We have a support area at the lower boundary of the channel at 3.35, which acts as strong support from which the price can rebound.
Entry price: 3.43
First target: 3.62
Second target: 3.80
Third target: 4.00

sui on long term bullish patternaccording to sui chart it shows bullish now and it will face to golden ratio resistance.

Wyckoff Cycle - Practical Example (SUI)Dear TradingView community and fellow traders,
I am Richard, also known as theSignalyst.
I find the SUI daily chart to be intriguing as it appears to be following the famous Wyckoff Cycle.
I would like to apply Richard Wyckoff's four market stages/phases to this chart for analysis as a practical example.
1️⃣ Accumulation
SUI rejected the $0.50 round number and entered an accumulation phase, consolidating for several months.
2️⃣ MarkUp
After breaking above the accumulation range at $1, SUI kicked off the markup phase.
3️⃣ Distribution
SUI found resistance at the $5.50 round number, with the lower bound of its range near $4—forming a wide distribution phase.
4️⃣ MarkDown
Once SUI broke below the $4 major low and exited the distribution zone, it transitioned into the markdown phase.
🔄🔄🔄🔄🔄⬇️
1️⃣ Accumulation
After finding support around the $2 round number, SUI hovered within a range, forming another accumulation phase.
2️⃣ MarkUp
We're here 🙂 This week, SUI broke above the $2.80 major high and the accumulation range—signaling the beginning of a new markup phase.
❓ What's next?
Will SUI continue to trade higher from here, or will this cycle play out differently?
I hope you find this post useful, and I would appreciate your likes and support.
Which scenario do you think is more likely to happen first? and why?
📚 Always follow your trading plan regarding entry, risk management, and trade management.
Good luck!
All Strategies Are Good; If Managed Properly!
~Richard

SUI/USDT Update - Approaching Channel Resistance! Let’s dive into the 1H chart for SUI/USDT.
Sui is riding a solid rising channel, showing strong bullish momentum!
Price has climbed from $2.25 since 22 April and is now at $3.59, with potential extention to the channel’s resistance at $4.00.
Key support holds at $3.00, with an intermediate level at $3.50.
If we break above $4.00, we could see a big move higher. But if rejected, expect a pullback toward $3.50 or $3.00.
Keep an eye on volume and price action at this resistance!
