SUI: Current SituationYou asked, and we delivered:
SUI is trading at $2.2616, navigating a volatile crypto market that’s down 4.4% in total market cap over the last 24 hours. As a Layer 1 blockchain, SUI stands out with its object-centric data model and Move programming language, emphasizing scalability and user accessibility. Its token serves multiple roles: staking, gas fees, utility, and governance. With a market cap of $7.51 billion and a circulating supply of 3.17 billion SUI (out of 10 billion), SUI ranks between #19 and #23 among cryptocurrencies. Recent trading volume is robust, ranging from $578.34 million to $742.90 million in 24 hours, signaling strong market activity. The price is well below its all-time high of $5.35 (January 4, 2025), with recent lows at $2.01 and highs at $2.42. Sentiment is mixed: some traders eye a breakout from a descending channel and partnerships as bullish, while others flag bearish divergence and a broken macro structure, hinting at downside risks to $1.30-$0.95.
Technical Indicators and Key Levels
Short-Term (1-Hour and Daily Charts):
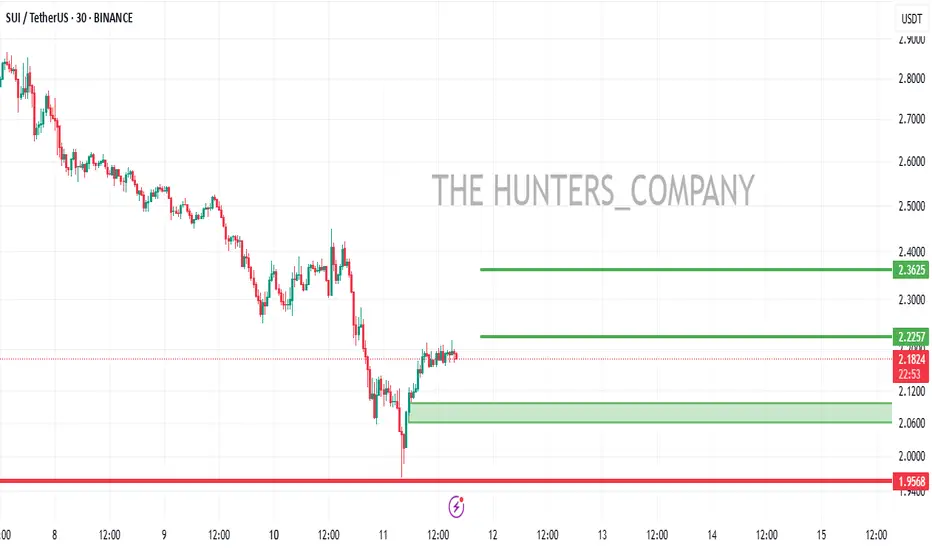
Support: $2.20 (immediate), $2.01 (cycle low)
Resistance: $2.38 (24-hour high), $2.42 (cycle high), $2.50
Indicators: RSI ~50 (neutral), MACD bearish but hinting at reversal. A hold above $2.20 could spark a rally to $2.38-$2.50.
Long-Term (Weekly Chart):
Support: $2.00, $1.30-$0.95
Resistance: $2.50, $3.00, $5.35 (ATH)
The 200-day MA is falling, reflecting long-term pressure, but holding $2.00 is key for bulls.
Potential Scenarios
Bullish Case: Hold $2.20, break $2.38 with volume → target $2.42-$2.50 (short-term), $3.00 (long-term).
Bearish Case: Drop below $2.20 → test $2.01; below $2.00 risks $1.30-$0.95.
Volume is critical—watch for spikes to confirm moves.
Broader Context and Tips
SUI’s fundamentals, scalability, user-friendly features like zkLogin, and ecosystem growth, offer long-term promise, but short-term risks loom. External factors like regulatory shifts or macro events (e.g., US inflation data) could sway its path. Traders should focus on $2.20, a hold keeps bulls in play, a break signals caution. Use tight stops (e.g., below $2.20 for longs) and stay alert for news on partnerships or adoption. Long-term, $2.00 is a key floor for accumulation.
SUIUSDT.PS trade ideas

BULLISH SCENARIOI'm seeing an ABCD Bullish Harmonic Pattern for SUI. I'm expecting more drop for SUI below $1. Congratulations those who are in short :)

SUI at major supportSUI Larger tf at major support around 2.20$ and bouncing at 50 week ma and last higher high support
Long term buy with stop below closing in daily

$SUI - Breaking of the IceSUI is still trending downward as its price continues to be rejected at the VWAP.
On the daily timeframe, we can expect the price to retest its daily demand zone around $1.70 and $1.60.
We are looking to enter a long position at this level, targeting the equilibrium around $2.80 to $3 (to break through resistance, or " break the ice ").
If we encounter any rejection at that level, we’ll then look to short, targeting $0.80.
This thesis would be invalidated by a clean reclaim of $2.50.


W back test explosive run W back test explosive run due, long, is very clear and plays out a lot in bullish scenario

SUI/USDTHello friends
Due to the recent decline, we have found a good support area for you, if it is reached, you can buy and move to the specified targets.
*Trade safely with us*
SUI/USDT 1H: Bullish Reversal Confirmed – Targeting $2.55?SUI/USDT 1H: Bullish Reversal Confirmed – Targeting $2.55?
🚀 Follow me on TradingView if you respect our charts! 📈 Daily updates!
Market Structure (Confidence Level: 8/10):
Bullish reversal confirmed after breaking $2.20 resistance with strong volume.
RSI shows hidden bullish divergence, supporting continued upside momentum.
Smart Money Analysis:
Major order block formed at $2.05-$2.10, confirming institutional accumulation.
Break of bearish market structure at $2.28, shifting momentum to the upside.
Clear accumulation pattern visible, indicating Smart Money positioning for a move higher.
Trade Setup:
Entry: $2.28 - $2.31 (current retest).
Targets:
T1: $2.45 (Fair Value Gap).
T2: $2.55 (major resistance).
Stop Loss: $2.05 (below recent swing low).
Risk Score:
8/10 – Strong risk-to-reward setup, but market volatility requires tight risk management.
Market Maker Activity:
Currently engineering liquidity build above $2.40, likely before the next leg up.
Volume profile supports bullish continuation, with Smart Money accumulating.
Recommendation:
Long positions remain favorable in the $2.28 - $2.31 range.
Monitor price action near $2.40 for signs of a breakout.
Use tight stops, given recent volatility, to protect against unexpected pullbacks.
🚀 Follow me on TradingView if you respect our charts! 📈 Daily updates!

Market in Crab Mode, but $SUI Still within Trend – Bidding at $2Bidding CRYPTOCAP:SUI under $2.1.
Although the market looks weak right now, this seems like a simple retrace into a good area. If it manages to hold the weekly trend, I don't see any problem with placing bids in this zone.
I believe BTC will need to create a new yearly low around the 75-76k range for my bids to trigger. For now, I'm fine with waiting.
Still think March will be mostly sideways or down. BINANCE:SUIUSDT

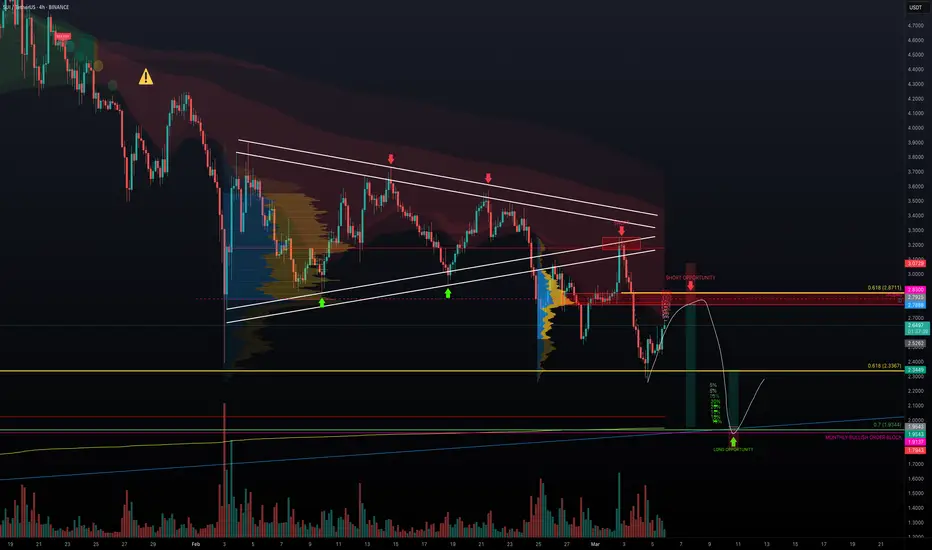
SUI - Short or Long? The Ultimate SUI Trade BlueprintHere’s an update to the analysis I did one month ago on February 10. Since then, SUI has continued to show its bearish tendencies—making lower highs and lower lows. After that dramatic 30% drop from a golden pocket short opportunity, the price started inching up on low volume. This weak rally suggests that while buyers are testing the ceiling, the overall trend remains down. That sets the stage for two possible plays: a short trade if the price reaches the resistance zone, and a long trade if it bounces off a strong support level.
1. Identification of Support and Resistance Zones
Resistance Zone (for the Short Trade):
Daily Resistance: ~2.7888
Point of Control (POC): Around 2.8035
Monthly Open: 2.83
0.618 Fibonacci Retracement: 2.8711
All these levels combine to create a robust resistance area where sellers are likely to step in.
Support Zone (for the Long Trade):
$2 Psychological Level: A key round number that attracts attention.
0.7 Fibonacci Retracement: Derived from the swing low of $0.4625 to the high of $5.3687, this places an important level at 1.9344 (just below $2).
Monthly Bullish Order Block: At 1.9137, indicating buying interest.
Fib Speed Fan (0.786): Points to support near the $2 mark.
POC: 2.0225
Anchored VWAP: Calculated from the deep low at $0.362, which again aligns around $2.
These multiple layers of confluence make the $2 area a strong support zone and an attractive entry point for a long trade.
2. Short Trade Setup
The Plan:
Building a short position gradually using a laddering strategy. With a $15,000 allocation from a $100,000 account, scale in at different levels to keep risk in check.
Scaling In (Entry Levels):
Entry # Entry Price % of Position Amount Invested ($)
1 2.6808 5% $750
2 2.7070 5% $750
3 2.7314 10% $1,500
4 2.7552 10% $1,500
5 2.7755 10% $1,500
6 2.7990 15% $2,250
7 2.8242 20% $3,000
8 2.8485 25% $3,750
Total: Avg. ~2.7924 $15,000
Stop Loss: Set at $3.07, limiting the risk to about $1,506 (roughly 10% of the trade allocation or 1.51% of the account).
Scaling Out (Exit Levels):
Exit Cover Price % of Position Amount Paid to Cover ($)
1 2.7925 5% $750.02
2 2.1715 5% $583.23
3 2.1365 10% $1,147.66
4 2.0981 20% $2,254.07
5 2.0630 20% $2,216.36
6 2.0257 10% $1,088.14
7 1.9930 15% $1,605.87
8 1.9625 15% $1,581.29
Outcome:
Total: Avg. ~2.09 $11,226.65
Net Profit: $15,000 (initial proceeds) – $11,226.65 (cost to cover) = $3,773.35
Profit % on Trade: +25.16%
Risk-to-Reward Ratio (R:R): Approximately 2.51
This laddering approach helps to secure profits at various levels while managing the risk effectively.
3. Long Trade Setup
The $2 support zone is a magnet, backed by multiple confluences. When SUI tests this area and shows signs of a rebound, it sets up a great opportunity to go long.
Key Support Details:
$2 Psychological Level: A well-watched price point.
0.7 Fibonacci Retracement: Places a key level at 1.9344 from the low ($0.4625) to the high ($5.3687).
Monthly Bullish Order Block: At 1.9137, adding to the support.
Fib Speed Fan (0.786): Confirms support near $2.
POC & Anchored VWAP: Both clustering around $2 (POC at 2.0225 and VWAP from a low of $0.362).
Trade Details:
Entry: Buy at $2.00
Target: Sell at $2.337 for an approximate 20%+ gain
Stop Loss: Set just below $1.80 to protect against further downside
Risk-to-Reward Ratio: About 2.44 or better
Wrapping It Up
In this dual-setup strategy, we're well-prepared for different market outcomes:
Short Trade: If SUI rallies into the tightly clustered resistance zone, scale into a short with defined entries, exits, and a stop loss that caps our risk at about 1.51% of the account. Exit ladder aims for an average cover price of around $2.09, netting a neat profit of approximately $3,773 (or +25.16% on the trade).
Long Trade: Conversely, if SUI finds strong footing at the confluence-rich $2 support zone, we can flip to a long position. Entering at $2.00, with a target of $2.337 and a stop loss below $1.80, gives an attractive risk-to-reward ratio of roughly 2.44.
This approach lets us capitalise on both sides of the market. Keep an eye on volume and price action. Happy trading! P.S. If you have any coin requests, feel free to share them in the comments. I will be selecting one or two for the next TA.
SUI’s Wild Ride – Finding the Next Long Trade SetupSUI had an incredible 2024, skyrocketing +1060% in just 154 days. The price peaked at the psychological $5 mark, where multiple rejections signaled a momentum shift. By the end of January 2025, the trend turned bearish, leading to a sharp correction.
Trend Shift & Momentum Analysis
I've been working on a new trend identifier indicator that helps spot trends, allowing traders to identify swing trade opportunities and manage their positions effectively. This indicator clearly highlighted the momentum shift, confirming the bearish turn and the sharp price drop that followed.
Key Support Zones & Confluences
Now that the bearish trend is in play, the focus is on identifying a solid long opportunity:
Point of Control (POC) from Previous Trading Range (~$2) – A major psychological level that many traders are watching
Trend-Based Fibonacci Extension (1:1) at $2.0373 – Adding confluence to this critical support area
Fib Speed Fan (0.75 Level) – Aligns with the $2 region, reinforcing support
Anchored VWAP (~$1.885) – From the 2023 lows, acting as an additional support zone
What’s Next for SUI?
The market is in search of a strong support level where bulls can regain control. Let’s see if we find support at the $3 mark. The $2 zone stands out as a prime area for a potential long entry, given the multiple technical confluences. If price reaches this level, we’ll be watching closely for confirmation of a bullish reversal.
Final Thoughts
SUI has had an extraordinary run, but corrections are natural in strong trends. The key now is to see where price stabilises and if the bulls can make a strong comeback. Time will tell how this plays out, but for now, $2 is a level to keep an eye on for a potential long setup.
BTW: I've just launched a FREE TradingView indicator – Multi Timeframe 8x MA Support & Resistance Zones. It helps visualise key support and resistance levels across different timeframes. Check it out and let me know your thoughts!

SUI LONGTaking a long on SUI. It has filled bullish weekly and daily fvg and held up the Weekly support level. I expect a dip to fill the entry as seen on chart and target the closest swing high liquidity. Use max of 8x leverage if you're using any.
GL!

SUI at Buy ZoneSUI at Buy Zone. I'm starting to take longs here and adding on with trend reversal confirmations.

SUI - What a Beautiful Prediction (Even Trump's Manipulation)I was asking myself: Will we have a reject from that purple zone?
Then Trump's post manipulated the market. After a rejection from AVWAP and some volume areas (like that POC and VAL) a Short under the purple area was obvious !
27 % 👌 🎯
Previous publish:
Follow for more ideas/Signals. 💲
Look at my other ideas 😉
Just donate some of your profit to Animal rights and rescue or other charity :)✌️

SUI LONG ALL trading ideas have entry point + stop loss + take profit + Risk level.
hello Traders, here is the full analysis for this pair, let me know in the comment section below if you have any questions, the entry will be taken only if all rules of the strategies will be satisfied. I suggest you keep this pair on your watchlist and see if the rules of your strategy are satisfied. Please also refer to the Important Risk Notice linked below.
Disclaimer


#SUI/USDT#SUI
The price is moving in a descending channel on the 1-hour frame and is adhering to it well and is heading to break it upwards strongly and retest it
We have a bounce from the lower limit of the descending channel, this support is at a price of 2.36
We have a downtrend on the RSI indicator that is about to break and retest, which supports the rise
We have a trend to stabilize above the Moving Average 100
Entry price 2.44
First target 2.51
Second target 2.64
Third target 2.78

#SUI/USDT#SUI
The price is moving in a descending channel on the 1-hour frame and is adhering to it well and is heading to break it strongly upwards and retest it
We have a bounce from the lower limit of the descending channel, this support is at a price of 2.40
We have a downtrend on the RSI indicator that is about to be broken and retested, which supports the rise
We have a trend to stabilize above the moving average 100
Entry price 2.48
First target 2.59
Second target 2.76
Third target 2.90

Lingrid | SUIUSDT continued DOWNTREND with NEW Lower LowsBINANCE:SUIUSDT is currently showing lower lows, indicating a selling trend in the market. Although it seems to have stabilized around the 2.50 level, a closer look at the price action reveals the formation of bearish long-tailed bars, suggesting potential for further declines. Given the prevailing bearish dominance, I think there is a possibility that the price may retest the support area above 2.00. I expect it to be a critical point for the market in the near future. The bearish sentiment suggests that we may look for opportunities to short the asset as it approaches this support level. My goal is support zone around 2.18
Traders, if you liked this idea or if you have your own opinion about it, write in the comments. I will be glad 👩💻

Sui new ranges for scalping - Currently making lower High lower Sui has been constantly forming lower low and lower high and it looks like its about to hit another lower low range marked and i will be aping in small from that range.

SUI DAILY TIMEFRAME UPDATE (ON DEMAND) ❤️ THIS POST AND I WILL SHARE NEXT 10X GEM COIN
Sui is a groundbreaking layer-1 blockchain platform designed to support the needs of global adoption by offering a secure, and scalable development platform
ANY THOUGHTS ON CRYPTOCAP:SUI ?

Sui: Mixed Signals With A Hard Chart (Bullish Later)I don't like it when there is too much empty space below the active candles, you what I mean? Below support here on the chart, there is just too much room for prices to move lower. But, when we are looking at a strong project things can be different but I still don't like it.
SUIUSDT. The level that worked as resistance in October 2024 is now working as support, March 2025. This is a good signal.
The action is still weak and there can be lower prices but, I bet there is some bullishness coming from the RSI and this indicator is what we will consider next.
The RSI bottomed 7-Feb. while SUIUSDT hit its lowest price 4-March. So we have a small bullish divergence, an early bullish signal.
The down-wave first bounced perfectly off 0.618 Fib. retracement, on a wick. Now there was a wick below this level but two close above. This is another positive signal but still early and still weak. So it is mixed.
It is possible that SUIUSDT can start to reverse, but the fact is that it is moving lower and there is now volume, yet, to support a bullish wave.
It will recover soon enough near support. It will recover very soon... That's for sure.
Allow for some swings but it won't be too long. The Cryptocurrency market as a whole will grow.
I am betting up.
Namaste.

SUI is hitting support can it pivot?SUI hit a good level of support but we need evidence of a reversal. A pivot point structure would give us the confidence that we are no longer in a downtrend.
Full TA: Link in the BIO
