TradeCityPro | SUIUSDT Is the best time to buy ?👋 Welcome to TradeCityPro Channel!
Let's analyze and review one of the most popular coins in the market, sui, and update our previous analysis and find new triggers
🌐 Overview of Bitcoin
Before starting the analysis, I want to remind you again that we moved the Bitcoin analysis section from the an
Related pairs

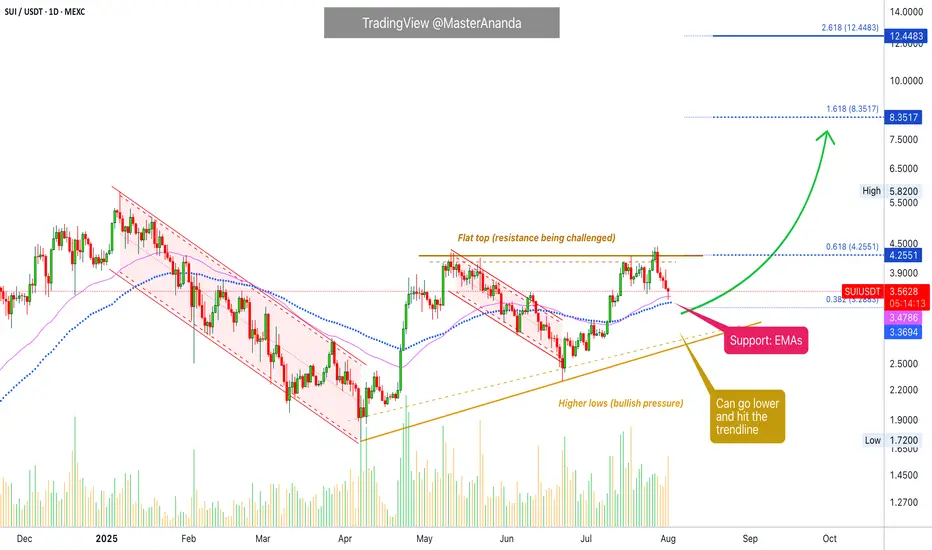
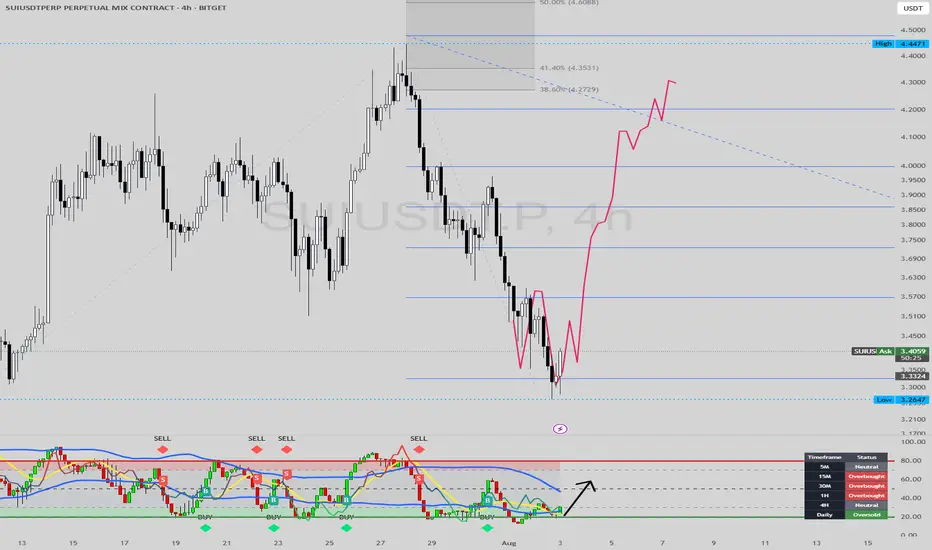
Sui Update · Support Found, Moving AveragesWe will focus solely on the chart. As a move happens, there are always fluctuations, down and up. What determines the trend is not the short-term but the broader market move. When a pair is producing higher highs and higher lows, we are growing and going up. If there is a drop short-term, this is no
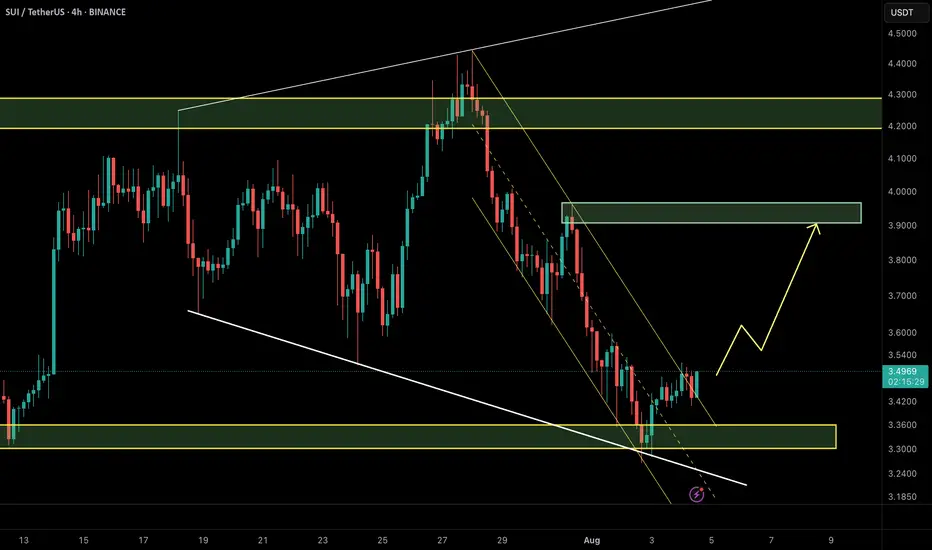
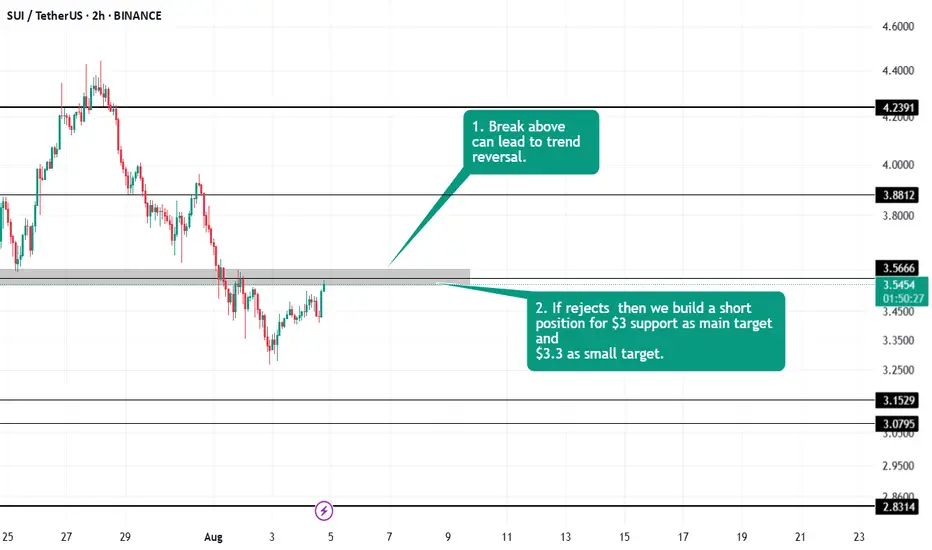
SUI/USDT – Price Outlook (2H TF)🔍 Updated Aug 4, 2025 | SMC + NeoWave
SUI has broken out of the descending channel and is currently holding above the strong demand zone around $3.35–$3.40. This zone overlaps with a bullish order block and prior trendline support.
📌 Bullish Scenario (preferred):
Price confirms support → Push towa
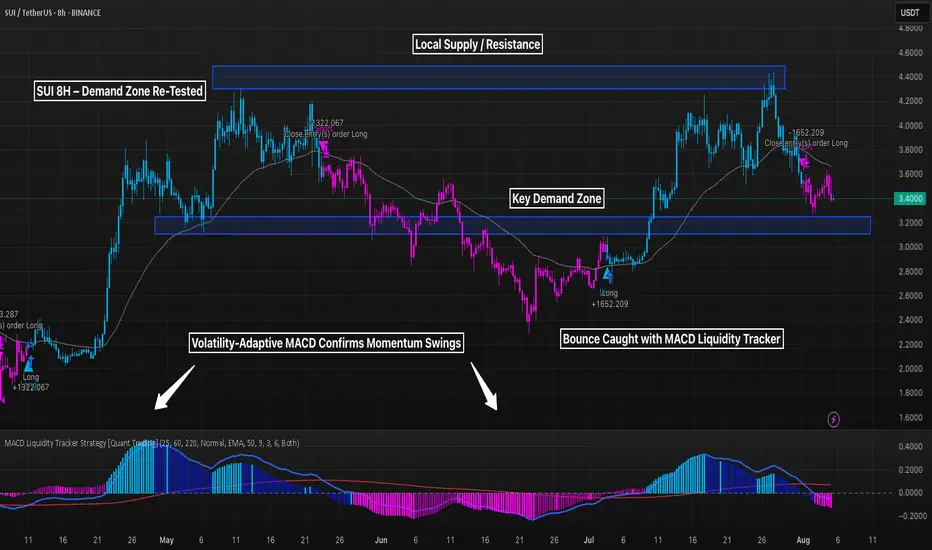
SUI 8H – Demand Zone Re-Tested, Will Strategy Fire Again Soon?SUI is approaching a major demand zone after rejecting from local highs near $4.60 — and the MACD Liquidity Tracker Strategy just closed its most recent long position. With momentum fading and price nearing structure, the next signal could be pivotal.
🔹 Strategy Settings
MACD: 25 / 60 / 220
Syste
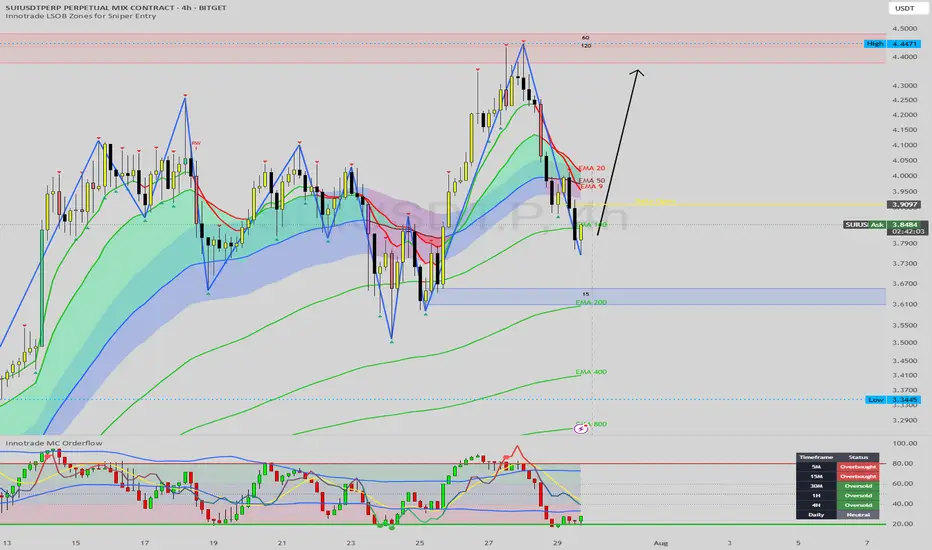
SUI Swing Buy / Long SetupSui is on Strong and decision Order block on 1 day Timeframe, If we break this then SUI will take correction till recent weekly low. If we hold this then new ath. Book some or 80% on mentioned area, rest hold till 6$.

SUI Approaching Major Buy Zone: A High-Confluence Long SetupHello, traders. Today, we're putting SUI under the microscope as it undergoes a sharp but healthy correction following an impressive rally. The price has recently broken below its short-term moving averages, and is now heading directly towards a powerful cluster of technical support. This is a class
SUI LONGFollowing a significant decline, the asset will take support and bounce back from this point.
Disclaimer: This is not financial advice.
This algorithm provides highly precise buy and sell signals with alerts:
#SUI TRADE PLAN Closely monitoring the trade. Would update once a decision candle is formed.
Keep watching
SUI/USDT: Prime Long Setup from LSOB Demand & Daily OversoldHello traders,
This analysis highlights a high-probability long setup on SUI/USDT (2H Chart). The current price action presents a classic institutional-style reversal pattern, strongly confirmed by momentum indicators signaling a bottom may be in.
1. Trend & Context (The "Why")
While the short-
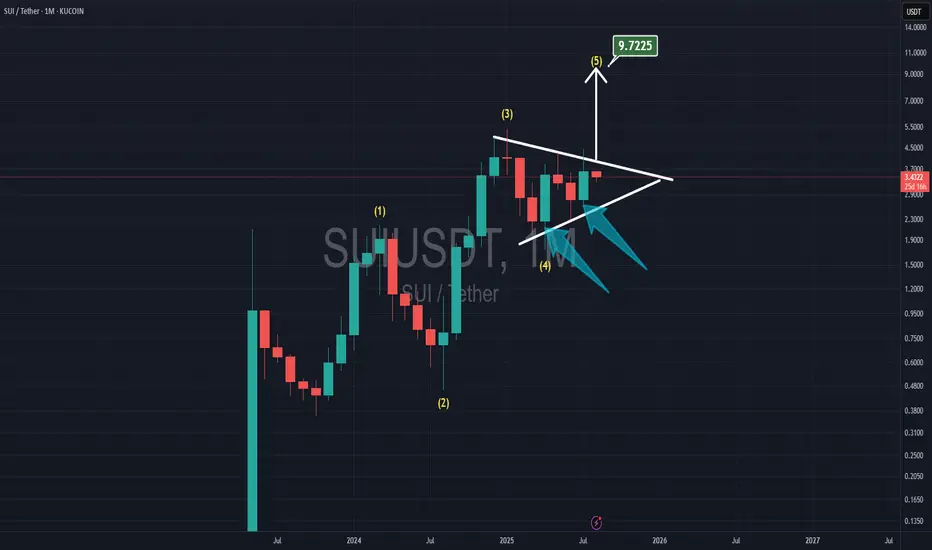
SUI TO $10.00With Elliot waves count, now SUI is in the 5th wave.
It has 2 bullish monthly candles for April & July, and SUI is playing inside the triangle which shows me with the breakthrough the resistance, the target is at $10
See all ideas
Summarizing what the indicators are suggesting.
Oscillators
Neutral
SellBuy
Strong sellStrong buy
Strong sellSellNeutralBuyStrong buy
Oscillators
Neutral
SellBuy
Strong sellStrong buy
Strong sellSellNeutralBuyStrong buy
Summary
Neutral
SellBuy
Strong sellStrong buy
Strong sellSellNeutralBuyStrong buy
Summary
Neutral
SellBuy
Strong sellStrong buy
Strong sellSellNeutralBuyStrong buy
Summary
Neutral
SellBuy
Strong sellStrong buy
Strong sellSellNeutralBuyStrong buy
Moving Averages
Neutral
SellBuy
Strong sellStrong buy
Strong sellSellNeutralBuyStrong buy
Moving Averages
Neutral
SellBuy
Strong sellStrong buy
Strong sellSellNeutralBuyStrong buy
Displays a symbol's price movements over previous years to identify recurring trends.
Frequently Asked Questions
The current price of SUI / TetherUS (SUI) is 3.7720 USDT — it has risen 6.53% in the past 24 hours. Try placing this info into the context by checking out what coins are also gaining and losing at the moment and seeing SUI price chart.
SUI / TetherUS price has fallen by −0.83% over the last week, its month performance shows a 30.40% increase, and as for the last year, SUI / TetherUS has increased by 511.54%. See more dynamics on SUI price chart.
Keep track of coins' changes with our Crypto Coins Heatmap.
Keep track of coins' changes with our Crypto Coins Heatmap.
SUI / TetherUS (SUI) reached its highest price on Jan 6, 2025 — it amounted to 5.3687 USDT. Find more insights on the SUI price chart.
See the list of crypto gainers and choose what best fits your strategy.
See the list of crypto gainers and choose what best fits your strategy.
SUI / TetherUS (SUI) reached the lowest price of 0.1000 USDT on May 3, 2023. View more SUI / TetherUS dynamics on the price chart.
See the list of crypto losers to find unexpected opportunities.
See the list of crypto losers to find unexpected opportunities.
The safest choice when buying SUI is to go to a well-known crypto exchange. Some of the popular names are Binance, Coinbase, Kraken. But you'll have to find a reliable broker and create an account first. You can trade SUI right from TradingView charts — just choose a broker and connect to your account.
Crypto markets are famous for their volatility, so one should study all the available stats before adding crypto assets to their portfolio. Very often it's technical analysis that comes in handy. We prepared technical ratings for SUI / TetherUS (SUI): today its technical analysis shows the buy signal, and according to the 1 week rating SUI shows the strong buy signal. And you'd better dig deeper and study 1 month rating too — it's buy. Find inspiration in SUI / TetherUS trading ideas and keep track of what's moving crypto markets with our crypto news feed.
SUI / TetherUS (SUI) is just as reliable as any other crypto asset — this corner of the world market is highly volatile. Today, for instance, SUI / TetherUS is estimated as 2.06% volatile. The only thing it means is that you must prepare and examine all available information before making a decision. And if you're not sure about SUI / TetherUS, you can find more inspiration in our curated watchlists.
You can discuss SUI / TetherUS (SUI) with other users in our public chats, Minds or in the comments to Ideas.