SUI - Leveraging Fibonacci & Elliott for Precision TradesSUI’s movement is rapid, sharp swings—both up and down. In volatile conditions like this, we aim 0.702–0.786 fib retracements (and occasionally 0.886 in harmonic contexts) for high‑probability entries. Below is a clear, Elliott-focused breakdown of the current setup and both long and short trade pla

TradeCityPro | SUI: Bullish Push Faces Key Resistance Test👋 Welcome to TradeCity Pro!
In this analysis, I want to review the SUI coin for you. It's one of the DeFi layer-1 projects that was highly hyped in 2024 and has recently gained renewed attention due to some news from the project.
🔍 This project's coin, with the symbol SUI, has reached a market cap

SUI Looks Bearish (2H)From the point where we placed the red arrow on the chart, it appears that the correction in SUI has begun.
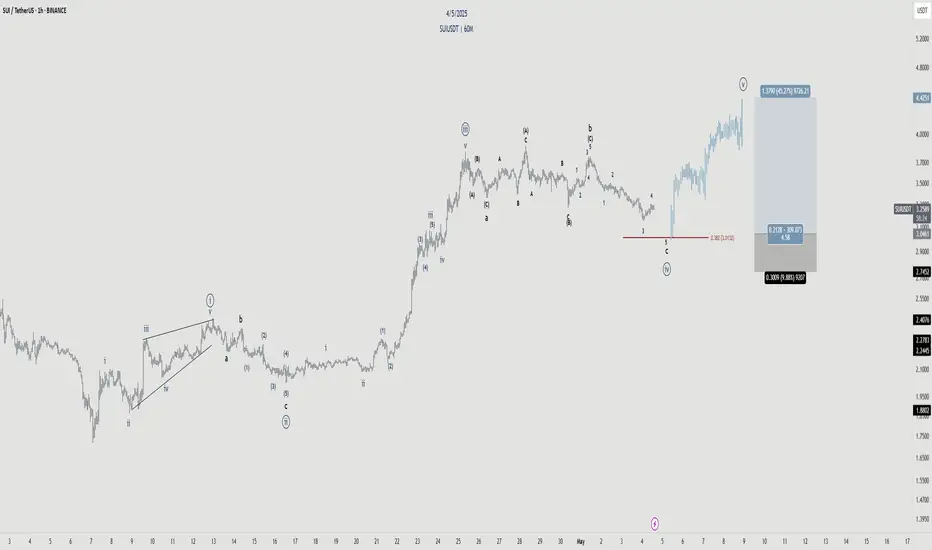
An expansionary wave structure is visible, which could potentially push SUI toward the green zone.
Targets are marked on the chart. As long as the supply zone holds, the price may move towar

SUI/USDT is currently reacting from a well-defined demand zone bSUI/USDT is currently reacting from a well-defined demand zone between 3.32–3.44, with multiple confluences suggesting bullish potential. A clear bullish reaction is forming off this base, giving a solid risk/reward opportunity.
Trade Plan:
Entry: 3.4682
Stop-Loss: 3.2718 (below the demand zone)

Sui: Your Altcoin ChoiceThe action is happening right above 0.786 Fib. retracement level support. Above it, the actual level wasn't hit and this is a signal of strength.
I looked at this chart when the action was happening above 0.618 and mentioned that it could drop further before the start of the next bullish wave. See

Sui (SUI): Might Be Selling Opportunity (If all goes by plan)Sui coin had a good MSB with recent news about trade deals by Trump. Now that we filled the FVGs, we are going to look for weakness to kick in, which would give us the final confirmation in the form of BOS and then we can see further movement to lower zones from here.
Swallow Academy

SUI ANALYSIS📊 #SUI Analysis
✅There is a formation of Descending Channel Pattern in daily time frame in #SUI .
Also there is a perfect breakout and retest. Now we can expect a bullish move. If the price successful retest the major support zone then we will see more bullish move
👀Current Price: $3.89
🎯 Targ

SUI BIG SHORT ALERT! CRYPTOCAP:SUI BIG SHORT alert !🚨
Just went short on Sui. Expecting a big drop today leading into tomorrow approximately -12%
Stop: $3.2738 or higher
Full tp: $2.83
DTT applied.
#SuiNetwork #Sui

SUI LOOKS STRONGSUI is consolidating neatly inside a textbook bull flag, just beneath major resistance at $3.74. This pattern typically signals continuation to the upside, especially when paired with bullish structure.
Importantly, the price is holding above the 200-day moving average, which has now flipped into s

SUI - Incoming wave 5Wave structure is very defined.
Currently looking for the completion of this corrective sequence of Wave 4 before we bounce at the key level 38.2%.
Targeting the high.
See all ideas
Summarizing what the indicators are suggesting.
Oscillators
Neutral
SellBuy
Strong sellStrong buy
Strong sellSellNeutralBuyStrong buy
Oscillators
Neutral
SellBuy
Strong sellStrong buy
Strong sellSellNeutralBuyStrong buy
Summary
Neutral
SellBuy
Strong sellStrong buy
Strong sellSellNeutralBuyStrong buy
Summary
Neutral
SellBuy
Strong sellStrong buy
Strong sellSellNeutralBuyStrong buy
Summary
Neutral
SellBuy
Strong sellStrong buy
Strong sellSellNeutralBuyStrong buy
Moving Averages
Neutral
SellBuy
Strong sellStrong buy
Strong sellSellNeutralBuyStrong buy
Moving Averages
Neutral
SellBuy
Strong sellStrong buy
Strong sellSellNeutralBuyStrong buy
Displays a symbol's price movements over previous years to identify recurring trends.
Related pairs
Frequently Asked Questions
The current price of SUI / TETHER (SUI) is 3.9699 USDT — it has risen 0.05% in the past 24 hours. Try placing this info into the context by checking out what coins are also gaining and losing at the moment and seeing SUI price chart.
SUI / TETHER price has risen by 13.69% over the last week, its month performance shows a 109.04% increase, and as for the last year, SUI / TETHER has increased by 292.86%. See more dynamics on SUI price chart.
Keep track of coins' changes with our Crypto Coins Heatmap.
Keep track of coins' changes with our Crypto Coins Heatmap.
SUI / TETHER (SUI) reached its highest price on Jan 6, 2025 — it amounted to 5.3695 USDT. Find more insights on the SUI price chart.
See the list of crypto gainers and choose what best fits your strategy.
See the list of crypto gainers and choose what best fits your strategy.
SUI / TETHER (SUI) reached the lowest price of 0.4626 USDT on Aug 5, 2024. View more SUI / TETHER dynamics on the price chart.
See the list of crypto losers to find unexpected opportunities.
See the list of crypto losers to find unexpected opportunities.
The safest choice when buying SUI is to go to a well-known crypto exchange. Some of the popular names are Binance, Coinbase, Kraken. But you'll have to find a reliable broker and create an account first. You can trade SUI right from TradingView charts — just choose a broker and connect to your account.
Crypto markets are famous for their volatility, so one should study all the available stats before adding crypto assets to their portfolio. Very often it's technical analysis that comes in handy. We prepared technical ratings for SUI / TETHER (SUI): today its technical analysis shows the buy signal, and according to the 1 week rating SUI shows the strong buy signal. And you'd better dig deeper and study 1 month rating too — it's strong buy. Find inspiration in SUI / TETHER trading ideas and keep track of what's moving crypto markets with our crypto news feed.
SUI / TETHER (SUI) is just as reliable as any other crypto asset — this corner of the world market is highly volatile. Today, for instance, SUI / TETHER is estimated as 6.97% volatile. The only thing it means is that you must prepare and examine all available information before making a decision. And if you're not sure about SUI / TETHER, you can find more inspiration in our curated watchlists.
You can discuss SUI / TETHER (SUI) with other users in our public chats, Minds or in the comments to Ideas.