sui on long term bullish patternaccording to sui chart it shows bullish now and it will face to golden ratio resistance.
SUIUST trade ideas

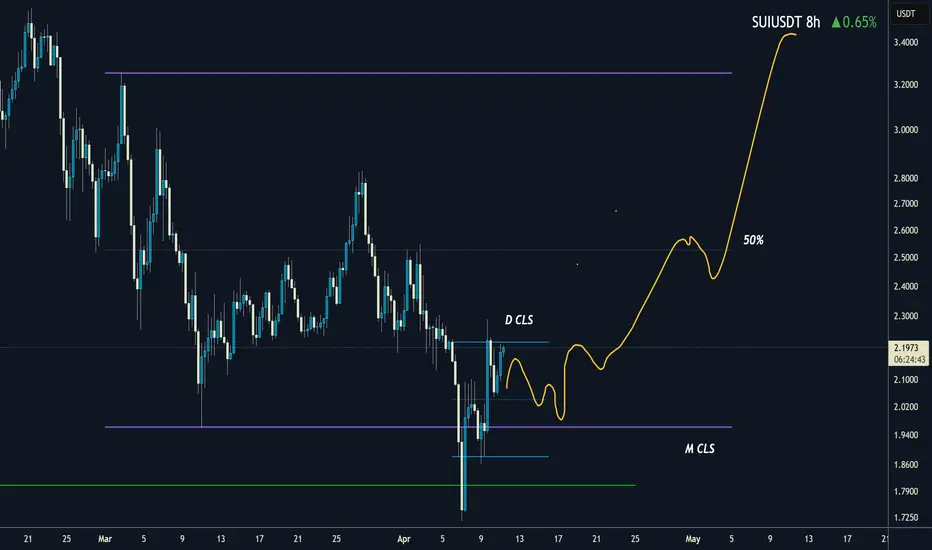
SUI I Monthly CLS I KL - OB I Model 1 I TP1 50% then openHey, Market Warriors, here is another outlook on this instrument
If you’ve been following me, you already know every setup you see is built around a CLS range, a Key Level, Liquidity and a specific execution model.
If you haven't followed me yet, start now.
My trading system is completely mechanical — designed to remove emotions, opinions, and impulsive decisions. No messy diagonal lines. No random drawings. Just clarity, structure, and execution.
🧩 What is CLS?
CLS is real smart money — the combined power of major investment banks and central banks moving over 6.5 trillion dollars a day. Understanding their operations is key to markets.
✅ Understanding the behaviour of CLS allows you to position yourself with the giants during the market manipulations — leading to buying lows and selling highs - cleaner entries, clearer exits, and consistent profits.
🛡️ Models 1 and 2:
From my posts, you can learn two core execution models.
They are the backbone of how I trade and how my students are trained.
📍 Model 1
is right after the manipulation of the CLS candle when CIOD occurs, and we are targeting 50% of the CLS range. H4 CLS ranges supported by HTF go straight to the opposing range.
📍 Model 2
occurs in the specific market sequence when CLS smart money needs to re-accumulate more positions, and we are looking to find a key level around 61.8 fib retracement and target the opposing side of the range.
👍 Hit like if you find this analysis helpful, and don't hesitate to comment with your opinions, charts or any questions.
⚔️ Listen Carefully:
Analysis is not trading. Right now, this platform is full of gurus" trying to sell you dreams based on analysis with arrows while they don't even have the skill to trade themselves.
If you’re ever thinking about buying a Trading Course or Signals from anyone. Always demand a verified track record. It takes less than five minutes to connect 3rd third-party verification tool and link to the widget to his signature.
"Adapt what is useful, reject what is useless, and add what is specifically your own."
— David Perk aka Dave FX Hunter ⚔️
$SUI to $4Hey traders,
Here's a quick video breakdown of our short-term trade setup for CRYPTOCAP:SUI — give it a look. Thanks!

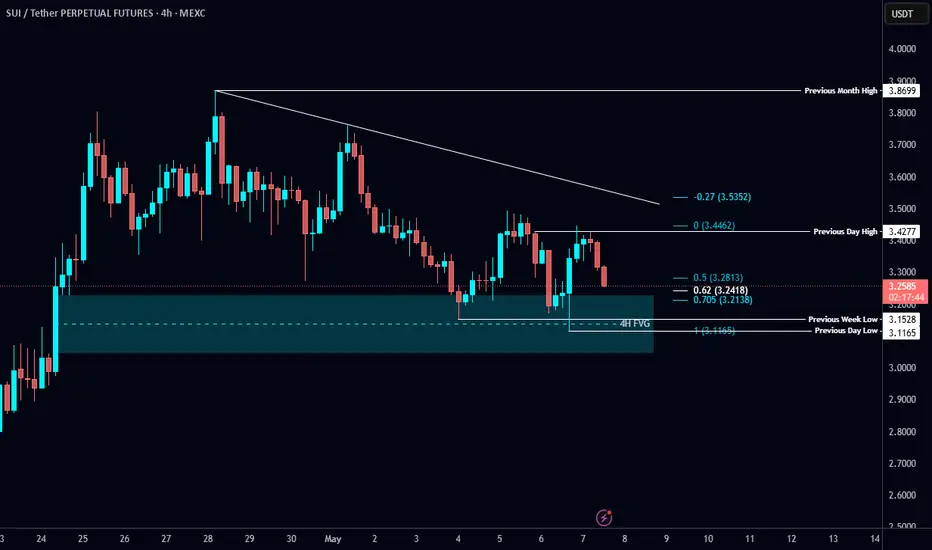
#SUI/USDT Analysis 📊 #SUI/USDT Analysis 📊
CRYPTOCAP:SUI swept the PWL as a Turtle Soup setup right inside the 4H FVG — showing early signs of reversal.
🔹 Currently tapping the OTE zone, looking promising for a long position.
🔹 Local resistance level: PML $3.87
FOMC approaching — ⚠️
Sui aggressive dump to $3.19Took a short on #SUI
CRYPTOCAP:SUI
It might wick back up a little for better RR...or not
See details on chart. Time sensitive

SUI/USDT Long Entry at 3.507 (10x Leverage) | Strategy in PlayEntered a long position on CRYPTOCAP:SUI at 3.507 with 10x leverage. Current price action is hovering near entry. Watching key levels:
🔹 Target Zone: 3.8760+
🔻 Support Zone: ~3.25 (highlighted for potential SL zone)
🧠 TP (Take Profit) and SL (Stop Loss) will be updated as the move develops.
Keep an eye on price reaction around the support-resistance flip zone.


SUI A&E or pullback firstAs BTC is keeping the line it looks lik it will pump towards 100K. In that level we can see a pull back to cool off the RSI.
SUI is looking strong and made u huge revovery from the $1,70 level from the 7th of april. In teh 4 h Charts we cab see an Bull Flag pattern, wit a deviation of the high in this pattern.
We need to see the recovery of the $3,86 level that must get support in orde to stay bullisch on the short term. Isn't this leven in soon then we can expect more retracement in the price alle the way towards the MA100 around $2,95 or even the MA200 at a level of $2,55.

SUI rising without building value +short-covering, ready to fallSUI had a significant rise in the past week. By extending last weeks pwProfile, we can see that the POC didn´t move at all. Value is far more important than price. Price is simply advertising opportunity. That´s why I strongly believe that it will retrace a lot. We also had some short-covering in the past days. Those profiles need to get re-inspected, making their POC an important target. There is pretty nice confluence with the pmPOC at 3.28 ish. Selling here at the highs of the current pwProfile or even above is a very good idea imo. Biggest risk for bulls, biggest opportunity for bears. I wanna see the pmPOC (previous month point of control) and pdPOC (previous day point of control) below. If price would break below, I would focus on the pwVAL next.

Sui Coin is Falling My custom indicator named SignalsWalaJin generated signal that sui coin will fall. It told "Becho means sell. You can see its falling.
Note this is not a buy sell trade call use stop loss.

SUIUSDT Daily Chart Analysis | Bullish Breakout, Fibo TargetsSUIUSDT Daily Chart Analysis | Bullish Breakout, Fibonacci Levels & Major Targets
🔍 SUI/USDT is showing powerful momentum after breaking out of its descending channel, now pressing against a significant daily resistance. Let’s break down the technical landscape, highlight key Fibonacci retracement zones, and outline the next bullish targets.
⏳ Daily Overview
SUIUSDT has decisively broken above the $4.0554 daily resistance, signaling a potential shift in market structure. This breakout is supported by strong volume and a clear reversal from the previous downtrend.
🔹 Fibonacci Retracement Levels
- The 0.5 correction level sits at $2.0830, a classic area for healthy pullbacks and potential re-accumulation.
- The 0.618 “faking” level is at $1.7594, often a zone for shakeouts and false breakdowns before a bullish continuation.
🔸 Key Resistance
- The $4.0554 level marks a critical daily resistance. A confirmed breakout and hold above this area paves the way for further upside.
🚀 Bullish Targets from Trend-Based Fibonacci Extension
- If SUIUSDT sustains above $4.0554, the next major bullish targets are $7.0373 and $9.6464. These levels are derived from trend-based Fibonacci extensions and represent the next potential resistance zones as the bullish trend unfolds.
📊 Key Highlights
- Strong breakout above daily resistance at $4.0554 with high volume.
- Watch for potential corrections to the 0.5 ($2.0830) and 0.618 ($1.7594) Fibonacci retracement levels for possible re-entry or confirmation of trend strength.
- The next bullish targets are $7.03 and $9.64, in line with the trend-based Fibonacci extension tool.
- These targets are only likely in a sustained bullish market environment.
🔎 Confirmation Checklist
- Monitor Bitcoin Dominance (BTC.D): A reversal or drop in BTC.D could favor altcoin rallies, including SUI.
- Watch SUIBTC: Outperformance of SUI against BTC would further confirm bullish momentum and the probability of reaching higher extension targets.
🚨 Conclusion
After breaking the $4.0554 daily resistance, SUIUSDT opens the door for a move toward $7.03 and $9.64, provided the broader crypto market remains bullish. Confirmation from BTC.D and SUIBTC pairs will be crucial for validating the strength and sustainability of this breakout. Stay alert for volatility and use Fibonacci retracement levels as key zones for managing risk and spotting new opportunities.
#SUI #CryptoAnalysis #TradingView #Altcoins #ACA

SUI Massive bounceCRYPTOCAP:SUI had a very nice bounce, currently pushing into resistance!
This weekly close will be key to see if we get a market structure shift or just a rejection.
In case we do get the Weekly MSS, we will hopefully get some kind of a retracement down towards $2.2 - $2.6. Even thought this chart looks very strong relatively to other charts out there.

SUI Emerging as a True Market Leader in the Current Crypto CycleIn the ever-evolving crypto landscape, market leadership is about more than short-term gains—it’s about sustained outperformance, relative strength, and consistent behavior around key technical levels. One asset that continues to meet that standard is SUI.
🔍 Tracking Leadership From Key Bottoms
Since the August 5 bottom, SUI has consistently ranked among the top-performing assets, showcasing strong momentum and market structure. This wasn't just a one-off move—SUI established itself as a relative strength leader in a decisive phase of the market.
Fast forward to the April 7 potential low, and once again, SUI is outperforming—this time, ranking #1 in gains(121.92% from Bottom to Top) among the top 30 crypto assets. That kind of consistent leadership at key inflection points isn't luck—it’s the hallmark of a market leader.
📈 Technical Strength Confirmed
SUI is not only rallying—it's doing so with technical conviction:
✅ Trading above the 200 EMA, a critical long-term trend indicator.
✅ Clean breakout above $2.8316, now acting as support.
✅ Follow-Through Day (FTD) confirmation in the general market, suggesting institutional buying power is returning.
As William O’Neil emphasized in How to Make Money in Stocks, market leaders often reassert themselves quickly after an FTD, often delivering the largest gains early in a new uptrend. That’s exactly what we’re seeing from SUI right now.
🌐 Why It Matters
Identifying true leaders during recovery phases provides a real edge—these assets often attract institutional capital, deep liquidity, and community momentum. With its strong chart structure, bullish fundamentals, and ecosystem growth, SUI is positioning itself as one of the most compelling assets to watch this cycle.
If you're focused on strength over hype, SUI should be on your radar.

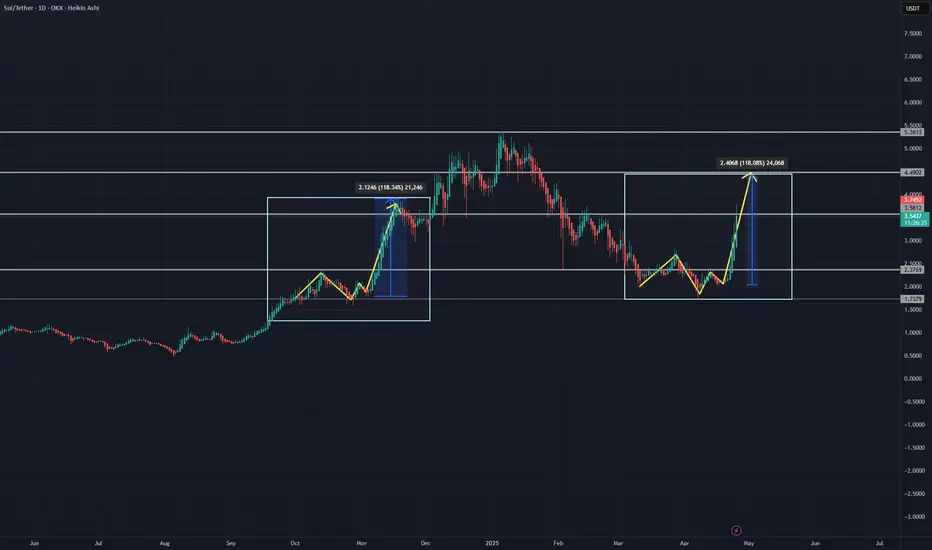
SUI: History Rhyming? A Potential 118% Repeat Pattern in PlayKEY POINTS:
- SUI/USDT previously formed a consolidation pattern with structured higher lows.
- This setup led to a strong breakout rally, resulting in a 118% price increase.
- The current price action is showing a very similar consolidation and breakout structure.
- A projected move could mirror the previous breakout, targeting a similar 118% gain.
- Key resistance levels overhead could act as major targets if the pattern plays out.
- Although history appears to be repeating, no two market cycles are exactly the same — caution is advised.
Traders should closely monitor for confirmation signs and always apply proper risk management. #paldogs
Wyckoff Cycle - Practical Example (SUI)Dear TradingView community and fellow traders,
I am Richard, also known as theSignalyst.
I find the SUI daily chart to be intriguing as it appears to be following the famous Wyckoff Cycle.
I would like to apply Richard Wyckoff's four market stages/phases to this chart for analysis as a practical example.
1️⃣ Accumulation
SUI rejected the $0.50 round number and entered an accumulation phase, consolidating for several months.
2️⃣ MarkUp
After breaking above the accumulation range at $1, SUI kicked off the markup phase.
3️⃣ Distribution
SUI found resistance at the $5.50 round number, with the lower bound of its range near $4—forming a wide distribution phase.
4️⃣ MarkDown
Once SUI broke below the $4 major low and exited the distribution zone, it transitioned into the markdown phase.
🔄🔄🔄🔄🔄⬇️
1️⃣ Accumulation
After finding support around the $2 round number, SUI hovered within a range, forming another accumulation phase.
2️⃣ MarkUp
We're here 🙂 This week, SUI broke above the $2.80 major high and the accumulation range—signaling the beginning of a new markup phase.
❓ What's next?
Will SUI continue to trade higher from here, or will this cycle play out differently?
I hope you find this post useful, and I would appreciate your likes and support.
Which scenario do you think is more likely to happen first? and why?
📚 Always follow your trading plan regarding entry, risk management, and trade management.
Good luck!
All Strategies Are Good; If Managed Properly!
~Richard

SUI Is Entering Into Final Stage Of Bull MarketHello, Skyrexians!
On yesterday's crypto pump BINANCE:SUIUSDT was the greatest performer and people started to have an interest in this coin will continue growing or this is just a bull trap. Let's try to understand it.
On the 1W time frame we have unclear, but Elliott wave structure. It looks like wave 4 overlapped with the wave 1. You will tell me that it's impossible. In practice it can happen especially on altcoins. According to the Awesome Oscillator wave 4 is finished which can be also confirmed by our Bullish/Bearish Reversal Bar Indicator . The final wave 5 will reach the green box, to have the more accurate target we need to count waves inside wave 5.
Best regards,
Skyrexio Team
___________________________________________________________
Please, boost this article and subscribe our page if you like analysis!

SUI Swing Long
SUI is in a confirmed M2 Wyckoff Accumulation
Target - Range High
Extended Target - New All Time Highs !

$SUI has nearly completed its correction — get ready!🚀 CRYPTOCAP:SUI has nearly completed its correction — get ready for a potential breakout in 4 weeks!
After an explosive push upward, a massive bearish divergence has formed — but the next leg could be just around the corner.
📊 Key signals:
MACD (1W) is about to flip bullish — a crossover expected in ~4 weeks.
RSI is near its previous bottom, signaling potential for a rebound.
Volume is matching levels seen during the last major rally.
📅 All signs point to May 19, 2025.
This could be the turning point.
CRYPTOCAP:SUI is in my buy zone at the moment (the green rectangle).
I project a new all time high.
📌 Stay sharp. Be prepared.
🧠 DYOR (Do Your Own Research)
#SUI #Altcoins #CryptoSignals #MACD #RSI #CryptoUpdate #May2025 #SUIUSDT #BullishSetup #DYOR

Crypto Bulls Awaken – Is This Just the Beginning?In the past 48 hours, the crypto market has brought joy to traders and investors who managed to buy near the bottom.
(Sorry to the cryptobros still holding floating losses—your time will come too! 😊)
Some of you might be thinking it's too late to ride this bull run. But if you zoom out and look at the bigger picture, there's still plenty of room for the bull to run.
Just switch to a higher timeframe like the weekly or monthly chart, and you'll see the potential upside.
One coin that looks particularly interesting is BINANCE:SUIUSDT .
There's been a pullback from 2.1829 - 1.7997, and it's supported by bullish divergence, suggesting a continuation of the impulsive move with 7.6108 as the first major target.
This bullish scenario remains valid as long as the price holds above 1.7174.
You might be wondering,
" So can I just buy/long BINANCE:SUIUSDT now? "
Not yet.
For a better entry and a more favorable risk-reward ratio, I suggest using the daily chart.
Wait for a pullback, then look for confirmation using candlestick patterns.
(I'll cover those patterns in my next post—stay tuned!)


SUI price analysis If we look at the OKX:SUIUSDT chart globally, you'll see that the April drop stopped at a retest of a strong mirror zone.
And even now, when the CRYPTOCAP:BTC price is trying to correct itself, the #SUI price is very well-supported.
Therefore, globally, any purchase of #SUI while the price is above $2.30 has a chance to turn into a good medium or long-term investment.
📈 On the chart, we have schematically depicted how the #SUIUSDC price may move in the future in 2025 with the final target of $10.8-11.80
_____________________
Did you like our analysis? Leave a comment, like, and follow to get more

SUIU/SDT BUY SETUP 2h chart analysisLooking at your SU/USDT 2-hour chart, here’s a breakdown of your trade setup based on the visible structure and markings:
Chart Summary:
Instrument: SUI/USDT (Spot)
Timeframe: 2H
Market Type: Bullish breakout with price creating higher highs and breaking previous structure.
---
Key Levels Identified:
Entry Point (Buy Zone): Around 2.3377 to 2.3820 (you're likely already in or watching this breakout area above the trendline).
Take Profit 1 (TP1): Around 2.5140 (minor resistance or structure area).
Final Target: Around 2.8500 to 2.9000 (marked as “swing high” on the chart).
---
Summary of Setup:
Entry: 2.3377 - 2.3820
SL: 2.1615 (or 2.0000 for safer margin)
TP1: 2.5140
Final TP: 2.8500 - 2.9000

SUI/USDT:BUYHello friends
Due to the price correction, we can buy in two designated areas in a stepwise manner. Elite with capital and risk management.
*Trade safely with us*
