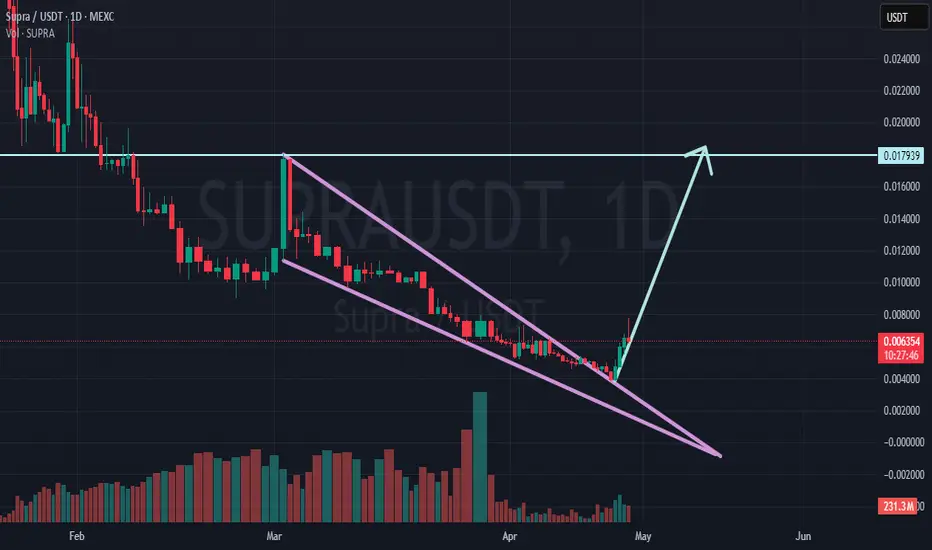
SUPRA: Classic Falling Wedge Breakout/Start of Bullish Uptrend The SUPRA/USDT daily chart highlights a textbook bullish reversal setup, marked by a well-defined falling wedge. Importantly, the extended downtrend within the wedge should not be seen as weakness — rather, it reflects a phase of strength through consolidation, as evidenced by the steady decline in
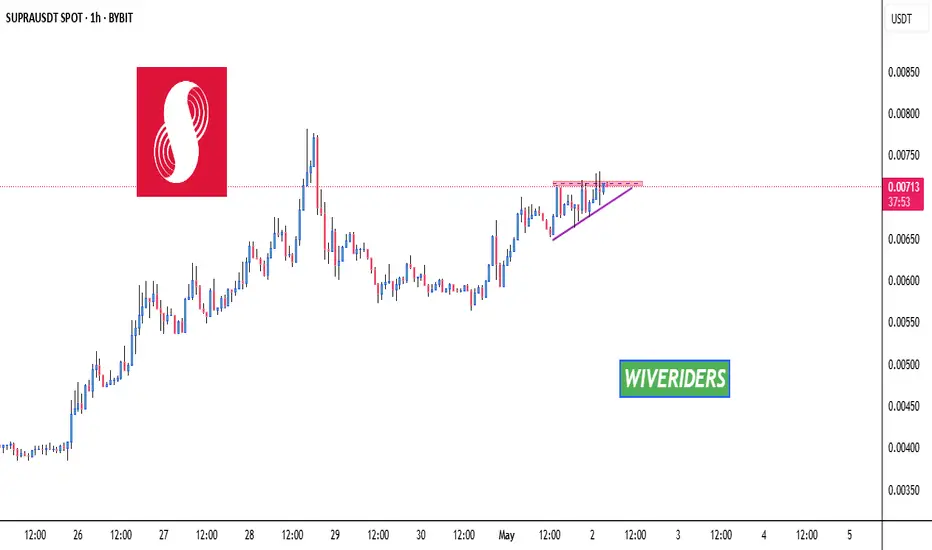
SUPRA is forming an ascending triangle patternSUPRA is forming an ascending triangle pattern and is approaching a key red resistance zone. A breakout above this level could confirm the bullish pattern and signal a strong upward move.
📈 Technical Overview:
Pattern: Ascending Triangle
Resistance Zone: Red area currently being tested.
🎯 Breakou
$SUPRA Breakout Confirmed — Trend Reversal in Play!$SUPRA just flipped the script!
After months of bleeding under a brutal downtrend, it finally broke out clean and confident.
That long-term resistance? Crushed.
Now it's retesting the breakout zone, a classic reclaim move.
EMAs are curving up, momentum's clearly shifting.
In my opinion, this break

Supra: Your Altcoin ChoiceThis Supra chart is barely four months old, so it doesn't meet our criteria of at least 6 months for a technical analysis, but the project looks good and the chart is easy to read. I had a good feeling as soon as I opened the chart so let's look into it anyway. It is my pleasure to do these analysis

SUPRA/USDTArea buy 0.006
SupraOracles is bridging real-world data to automate, simplify, and secure the smart contracts of financial markets.

$SUPRA is approachingAnalysis 🚨
$SUPRA is approaching the red resistance zone 🔴. If the breakout is successful, the next target will be the green line level 🟩!
🎯 Target:
✅ Green line level

SUPRA chart updated analysisThis is a follow on from previous SUPRA analysis here:
Left chart:
Price holding the possible reversal bullish divergence forming along pink trendlines.
EMA8 blue line is still holding price down and the Stoch RSI is back to bearish zone.
Right chart:
I drew in a different trendline(green)

SUPRA chart analysisSo far I have called every move on SUPRA since joining the SUPRA tribe.
What we see on this chart is SUPRA is in a downtrend still rejecting off fib pocket each time. I have not shown the fib indicators here to show this as the chart would be too messy.
On the Stoch RSI we can see each time it cro

time to buyHello, traders! What are your predictions regarding the possible price movements for SUPRAUSDT in the coming days?
Don’t hesitate to share your insights and opinions!

BULLISH SUPRATechnically the price holded on support level when BTC dump last week and SUPRA make the pattern bullish penant.

See all ideas
Summarizing what the indicators are suggesting.
Oscillators
Neutral
SellBuy
Strong sellStrong buy
Strong sellSellNeutralBuyStrong buy
Oscillators
Neutral
SellBuy
Strong sellStrong buy
Strong sellSellNeutralBuyStrong buy
Summary
Neutral
SellBuy
Strong sellStrong buy
Strong sellSellNeutralBuyStrong buy
Summary
Neutral
SellBuy
Strong sellStrong buy
Strong sellSellNeutralBuyStrong buy
Summary
Neutral
SellBuy
Strong sellStrong buy
Strong sellSellNeutralBuyStrong buy
Moving Averages
Neutral
SellBuy
Strong sellStrong buy
Strong sellSellNeutralBuyStrong buy
Moving Averages
Neutral
SellBuy
Strong sellStrong buy
Strong sellSellNeutralBuyStrong buy
Displays a symbol's price movements over previous years to identify recurring trends.