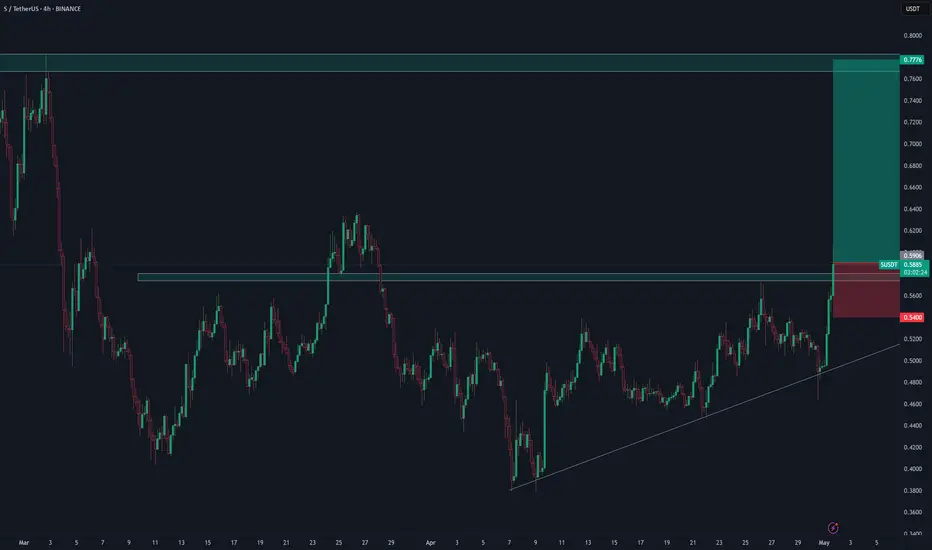
S/USDT Potential UpsidesHey Traders, in today's trading session we are monitoring S/USDT for a buying opportunity around 0.5850 zone, S/USDT is trading in an uptrend and currently is in a correction phase in which it is approaching the trend at 0.5850 support and resistance area.
Trade safe, Joe.
SUSDT trade ideas

SONIC/USDT – Breakout Setup (15m Chart)SONIC/USDT – Breakout Setup (15m Chart)
Price is testing the descending trendline resistance after forming a potential higher low. A breakout from this trendline with strong volume may signal a bullish reversal.
Entry: Around 0.5825
Stop Loss: Below 0.5650
Target: 0.6248 - 0.6663
Risk/Reward ratio is favorable. Waiting for confirmation candle close above the trendline.
Not financial advice. Just sharing my analysis.


SUSDT - This opportunity might not come around again.!All tokens built on the Ethereum network pumped yesterday as ETH moved up by just 4%, and SONIC (S) stood out as the top performer among them, surging by around 22%.
Currently, the coin has formed a symmetrical triangle pattern, which has been broken to the upside with a massive green candle. It's now retesting the 0.382 Fibonacci level — a key zone to watch for continuation.
This is a massive investment opportunity to buy the token at around $0.55 only.
The long-term targets for S in 2026 are insane — the most conservative target for now is $1.20.
Best regards Cecilion🎯

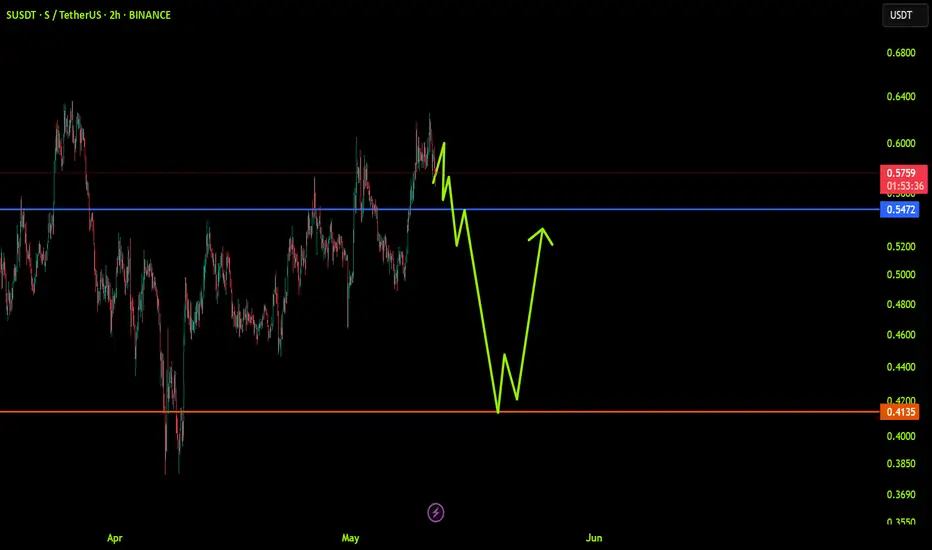
SUSDT: trend in 2H time framesThe color levels are very accurate levels of support and resistance in different time frames, and we have to wait for their reaction in these areas.
So, Please pay special attention to the very accurate trend, colored levels, and you must know that SETUP is very sensitive.
Be careful
BEST
MT

S COIN READY FOR BUY LONGS coin sweept previous low liquidity and did internal MS while leaving behind FVG and OB. Will enter here after bullish confirmation.

SONIC preparing for departure. SONIC is still within range and has not broken out. Price action is at the top of the range and is technically at resistance. Longing into resistance is not the best strategy; however, a breakout could happen anytime. Consider laddering in within the range, preparing for any possible BTD opportunities.
Full TA: Link in the BIO

S or old FTMAs a blockchain platform the price of S with a stable growth ecosystem must be over 2$ not such prices,and I dont understand the traders of this coinn vs Sui or others....lets push it to the Moon...

S/USDT 4H1. Price Trend and Key Levels
The current price is around 0.5250, attempting to hold above that zone.
Key resistance levels:
0.5300 (first major resistance)
0.5900 – 0.5999 (strong resistance zone)
0.6450 (long-term resistance)
Key support levels:
0.4585
0.4010 (stronger support at channel bottom)
---
2. Indicators Overview
BB %B (Bollinger Band Midline)
Currently below the midline, indicating past selling pressure. However, the indicator is curving upward, suggesting a possible shift toward buying.
WaveTrend (WT_LB)
Both WT lines have bounced from the oversold area (below the -60 green line), signaling a potential start of a bullish wave.
---
3. Trendlines & Channels
Multiple descending trendlines from the previous top (in blue) act as dynamic resistance.
Price is fluctuating between the blue channels marked 50000 and 30000.
---
Conclusion – Long or Short?
Long Scenario:
If the price breaks and holds above 0.5300 with strong volume:
Target: 0.5900 to 0.5999
Stop-loss: Below 0.5150
Short Scenario:
If the price fails to break 0.5300 and forms a strong bearish candle:
Target: 0.4585
Stop-loss: Above 0.5350
---
Final Thought:
Momentum is shifting toward the bulls, but there’s no strong confirmation yet. It’s better to wait for a clear breakout above 0.5300 before entering a strong long.
If you prefer an early entry, a light long position with tight risk management could be considered.
Would you like a precise entry strategy with targets and risk/reward?

SUSDT , long opportunity
Sonic (SUSDT) is currently trading within a long-term ascending channel on the weekly timeframe, indicating a bullish macro structure. Price action has respected both the upper and lower bounds of the channel multiple times, showing strong trend continuation behavior.
On the daily timeframe, Sonic is currently forming a falling wedge pattern, which is typically a bullish reversal pattern. However, the price is still trading below the descending resistance line of the wedge, suggesting that a breakout has not yet occurred.
Key levels to watch:
Immediate resistance is the upper boundary of the wedge and the descending trendline. A breakout above this zone could trigger a bullish move toward $1.47, the next significant high.
Immediate support lies around $0.5

it's Bullish BUT Wait!!Ithink we have a some liquidity in lower prices and then we can fly to 70 cents and beyond it

SUSDT Potential UpsidesHey Traders, in today's trading session we are monitoring SUSDT for a buying opportunity around 0.4890 zone, SUSDT is trading in an uptrend and currently is in a correction phase in which it is approaching the trend at 0.4890 support and resistance area.
Trade safe, Joe.

long SonicSonic broke through a major resistance level. Bullish movement is expected to continue and reach $0.77
Sonic is at a good level to get the support it needsS is going sideways in a tight range. RR is as good as it gets. Trend and momentum oscillators are showing signs of bullish strength, however, Sonic price action has not left the station. Buy low, sell high.
Full TA: Link in the BIO

Sonic Token consolidation| Price Action| Trend Sonic Token has been consolidating inside a well-defined range for 48 days, with no breakout confirmation yet. Price action remains suppressed beneath strong resistance layers including the VWAP SR, the 0.618 Fibonacci retracement, and the value area high.
Volume remains steadily below average, reinforcing the idea of rotational movement. Until volume spikes significantly, price action is expected to continue oscillating within the range. Sonic Token is currently sitting near the midpoint of the range — losing this level could trigger a cascading move toward untapped liquidity below, sweeping lower supports.
If price manages to reclaim the VWAP SR resistance with a confirmed closing candle, a move back to the range high becomes likely. Until then, the overall bias remains neutral to bearish, with the expectation of further consolidation unless strong volume intervention shifts the market structure.


SUSDT: trend in daily time framesThe color levels are very accurate levels of support and resistance in different time frames, and we have to wait for their reaction in these areas.
So, Please pay special attention to the very accurate trend, colored levels, and you must know that SETUP is very sensitive.
Be careful
BEST
MT

Sonic BoomSonic has retraced from 1$ to pretty much again 0.38 and now it has made Inverse Head and Shoulders on 1D and same on 4H
accumulate around 0.40 & 0.46
can Pump target 0.73$
50% pump
Sl daily close below 0.37

S (EX FTM) Update (4H)Like many other altcoins, S has formed an Inverse Head and Shoulders pattern, signaling a potential trend reversal.
Additionally, a bullish flag formation has broken out on the lower timeframes, further confirming the upward momentum.
The current price structure appears suitable for long positions, especially with confluence from multiple technical signals.
A conservative target lies around the $0.64 level, based on the measured move projections from the flag and neckline breakouts.
— Thanks for reading.


Short position SUSDT RR=3Short position for swing style in SUSDT
TP and SL is obvious.
if you have any question leave a comment

SUSDTHello to all AMKT friends, I hope you had a good day.😍
Let's move on to the analysis of Coin S.
In the monthly timeframe, we do not have specific data due to the newness of the project.
But in the weekly timeframe, we are involved in the box range between the prices of 0.4385 and 0.5497, and exiting this box range along with increasing volume can cause a sharp move, and because of the recent days when the market has been bullish, we know that the probability of exiting above the box range is higher.
In the daily and 4-hour timeframe, we also exited the descending triangle pattern, and usually after this event we see a range and then an upward move. So for a long position, we can enter a long position after breaking 0.5497 and increasing volume.
Have a good and profitable day
