SUSHIUSDT 1D AnalysisSUSHI ~ 1D Analysis
#SUSHI Buy when re -testing this support block with a short -term target of at least 10%+ from here.

SUSHIUSDT Holding Strong Support — Bullish Ahead?"SUSHIUSDT Technical analysis update.
SUSHIUSDT has respected a strong horizontal support zone for several years, as shown by multiple successful retests. Every dip into this support area has triggered a notable bounce.
Currently, SUSHI is once again bouncing off this major support, and the price a

SushiSwap: Your Altcoin ChoiceAnother great chart. In December 2024 SushiSwap hit its highest price since December 2020 on a bullish move. In general, December 2024 produced the highest level since April 2022. Really something, a multiple years long high.
How are you doing today my friend in the law?
I hope you are having a won

SUSHI is Bleeding Out — Is This the Calm Before the Final Dump? Yello, Paradisers! Have you been ignoring SUSHI lately? That might be a mistake — because the price action is showing signs that a deeper drop could be just around the corner, and those not paying attention could get caught off guard. Let’s break it down.
💎#SUSHIUSDT is still trading below both the

SUSHIUSDTRSI indicates Bullish Divergence. Which means that at any time the market trend can change to HH and HL.

$SUSHI at a Turning Point – Breakout or Rejection?
CRYPTOCAP:SUSHI is at a critical juncture, attempting to break key resistance levels. A successful breakout could confirm a trend reversal and open the door for further upside.
SUSHI 1D Update:
- Breaking out of a **descending triangle**, which could signal bullish momentum if confirmed.

SUSHIUSDT 1WSUSHI ~ 1W Analysis
#SUSHI Buy gradually from here with a short -term target of at least 20%+. This is the lowest support for now.

sushiusdtsusshi may have completed accumulation pattern and it might have come for atest of the lows before moving up .red line invalidation

Short trade
1Hr TF overview
Sellside trade
Sat 8th March 25
6.00 pm
Tokyo Session PM
Structure/Day
Entry 4Hr TF
Entry 0.6715
Profit level 0.5840 (13.03%)
Stop level 0.6794 (1.18%)
RR 11.08
Reason: Observing price action, the Day TF seemed indicative of a Sellside trade using the narrative o

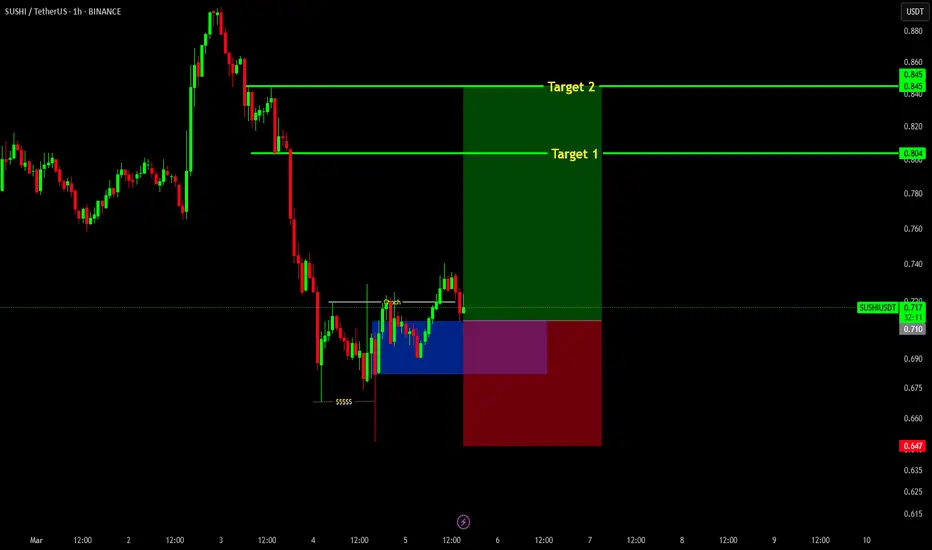
Sushi long trade setupSushi recently on 1hr time frame gave a proper ChOCh which is a bullish setup.
Entry region marked (blue box)
Stoploss at 0.647
Targets: 0.805, 0.845
See all ideas
Summarizing what the indicators are suggesting.
Oscillators
Neutral
SellBuy
Strong sellStrong buy
Strong sellSellNeutralBuyStrong buy
Oscillators
Neutral
SellBuy
Strong sellStrong buy
Strong sellSellNeutralBuyStrong buy
Summary
Neutral
SellBuy
Strong sellStrong buy
Strong sellSellNeutralBuyStrong buy
Summary
Neutral
SellBuy
Strong sellStrong buy
Strong sellSellNeutralBuyStrong buy
Summary
Neutral
SellBuy
Strong sellStrong buy
Strong sellSellNeutralBuyStrong buy
Moving Averages
Neutral
SellBuy
Strong sellStrong buy
Strong sellSellNeutralBuyStrong buy
Moving Averages
Neutral
SellBuy
Strong sellStrong buy
Strong sellSellNeutralBuyStrong buy
Displays a symbol's price movements over previous years to identify recurring trends.