Sushi Can Grow 150%+ vs TetherWe can see the classic "cup pattern" on the SUSHIUSDT chart, this can signal that the trend is about to reverse.
As you can see on the left side, each time this bottom pattern shows up prices tend to grow.
We also have a broken downtrend as we all as increasing volume and bullish indicators (strong RSI).
All these signals support higher prices.
Note: There can be a retrace before higher prices as it happens with the cup & handle pattern.
The targets are marked on the chart.
This is not financial advice.
Namaste.
SUSHIUSDT.PS trade ideas

SUSHIUSDT is creating a pennantSUSHIUSDT is creating a pennant below the weekly resistance.
We need to watch two key levels and wait for the breakout, According to Plancton's strategy (check our Academy ), we can set a nice order
–––––
Follow the Shrimp 🦐
Keep in mind.
🟣 Purple structure -> Monthly structure.
🔴 Red structure -> Weekly structure.
🔵 Blue structure -> Daily structure.
🟡 Yellow structure -> 4h structure.
⚫️ Black structure -> <4h structure.

sushi/usdt breakout sushi/usdt broke out the downward trendline
and taking retest at the support level
#dyor

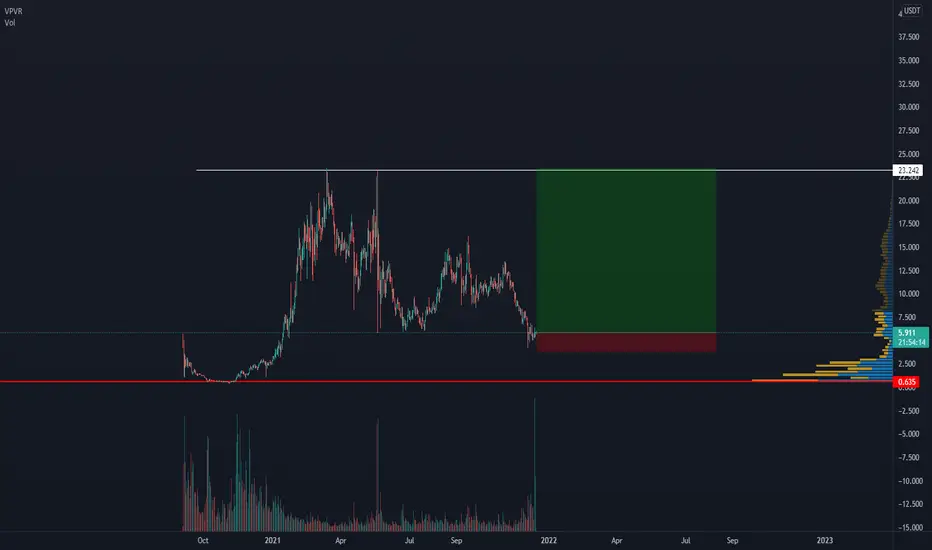
SUSHI - is going to break this trendline 👀SUSHI has been in a local downtrend for a long time. We now see the price in a trading range between $5 and $6.3 levels. It is very likely that big players are accumulating their positions here. The large volume at the bottom signals this as well. A breakdown of the trend line could be a good buying opportunity. In case the big value area is broken, there could be a trend reversal.
Write in the comments all your questions and instruments analysis of which you want to see.
Friends, push the like button, write a comment, and share with your mates - that would be the best THANK YOU.
P.S. I personally will open entry if the price will show it according to my strategy.
Always make your analysis before a trade.

Sushi Looking sexy. Need to pop and hold above 8.30 but it’s above all of my indicator reisatnce which is really somthing that could cause a HUgE run in the next few weeks and months fo sushi. Somehinf hige is on the horizon

SUSHISWAP COIN NEXT PUMP, (SUSHI) PRICE PREDICTION 2022SUSHI price prediction using a simple price action strategy. Fundamentals analysis and technical analysis included. Can SUSHI price recover and see more bounce before any more dump?

#SUSHIUSDT Prise actionWe took first reaction from Order Block.
I will rebuy from FTR zone. I'm bullish bias
This is not investment advice

SUSHİ/USDTSUSHI broke the long-time downtrend and made a double bottom formation in the daily period and entered the uptrend


It Will Be Historical Move Of SushiSwap (SUSHI)Hi friends, hope you are well and welcome to the new update on SushiSwap (SUSHI).
broke out with bullish divergence:
On a daily time frame, the priceline of Sushi has broken out down channel with bullish divergence.
Big bullish Gartley:
On a weekly time frame, SUSHI has formed a bullish Gartley pattern.
In order to trade this pattern the targets can be as below:
Buy between: $8.04 to $5.96
Sell between: $11.16 to $14.45
Stop loss:
Stop loss can be set below the maximum extent of buying zone which is $5.96
Possible profit and loss ratio:
As per the above targets, this trade has a profit possibility of up to 142% and a loss possibility is 26%.
Big falling wedge:
On the same weekly time frame the priceline is also rising from the support of a big falling wedge pattern. The big bullish reversal Gartley move can become a big coz of breaking out this falling wedge and in case of breakout, wedge Sushi can start a massive rally for the long term.
Note: Above idea is for educational purpose only. It is advised to diversify and strictly follow the stop loss, and don't get stuck with the trade.

SushiusdtHi. correction touched 0.78 fibo and now we see price is going up. Price is very attractive for buy. Resistance and target are in chart( fibo levels). Good luck.

SUSHIUSDT ANALYSISAs you can see Engineering Robo is currently bearish on SUSHI
If you are interested in putting 1,000$ into SUSHI
Buy 20% at support
Buy 30% when candle open / close above downtrend line
Buy 50% when Robo turns bullish
Take some profit at resistance! (>50% increase from local support)
Be cautious!
If the candle open / closes below the support, No need to hold SUSHI
we can easily expect a 50% DROP In this case
Sell if candle open / close below support (even with some loss)

SUSHI possible setupSUSHI is looking to flip the resistance, making it a support.
If 12/21 EMA are doing a bullish crossover and we are bouncing from the new support, then i'm longing it
GL to all

SUSHIUSDT-LONGThere is a long position in SUSHIUSDT SUSHI
SUSHIUSDT SUSHI
🔵Long Now or set on Key Level 5.100
🟢Target 1 5.430
🟢Target 2 5.975
❌Stop loss 4.950
#K_Level

WAIT FOR MORE BEARISH WAVES TO RIDE THE BULLISH IMPULSE🌊✅PREVIOUSLY ON SUSHI
After 23.43, we are having the zigzag long corrective waves.
✅ WHERE WE ARE
We wanna buy as low as possible. if 16.2 is B, we will have the bullish impulse after 5 waves from B.
It seems like the good zone to be bullish around 3.35
💡0...0(BUY)
↗️5waves(impulse)
💡1...15.97(SELL)
↘️simple short 1wave(correction)
💡2...0.472(BUY)
↗️5waves(impulse)
💡3...23.43(SELL)
↘️Zig zag long 3waves(correction)*Rule of alternation
💡4...around 3.35?(BUY)<We should wait for this
↗️5waves(impulse)
💡5...*(SELL)
*As long as * remains unbroken, this idea is valid.
💡The absolute principle for trading💡
BUY - as low as possible
SELL - as high as possible
PLEASE DO NOT FORGET TO SMASH LIKE👍🏻 AND FOLLOW ME❤ IT MOTIVATES ME TO THE NEXT IDEA! THANK YOU 🎉

SUSHI Long position, good R:R entry with potential futureSUSHI long position added in the dip yesterday at 5.38 leveraged long.
This looks a great area to add SUSHI for a long term hold. Wonderland.fi project is looking to acquire SUSHI which will bring huge volume of trading to the company.
Technically - SUSHI has fallen to solid resistance and buys below 5.5 offer a good R:R.
This chart abides by 2 of my main long term rules.
1. Buy when below the 100 and 200 SMA. - I've drawn around these areas on the chart, always offering a good R:R.
2. Buy at the bottom of resistances, not at the top of supports.

SUSHI BREAKOUT!Hi! this is my SUSHI/USDT set up for the upcoming week:)
Hope you will like it! if you have any feedback about the chart pls feel free to tell me:)
MY IDEA ONLY NOT A FINANCIAL ADVICE!!!
Love Yall :)

You can buy #SUSHI in Dip hereGood volume is being injected in this coin over recent period and also looking for Breakout. Can show a reversal here.
Entry : Around 5.9$
Targets : 6.6$,7.5$,8.8$,10$+
Stoploss : Daily close below 5$

Sushi (Bullish) broke out from down trend (possible 50% plus)Hello, after the fed announcement, the crypto market was more stabilized and had a slight rebound. Fed announced double-down on tapering, which was expected by the market. The most fear was from possible interest rate hike, however, fed announced no interest rate hike for nowbut there gonna be 3 rounds starting next year. Both stock market and crypto reacted bullish to the news. Sushi retraced from 13.50 in november to now 5.95 cents. As you can see Sushi has broke out from the downtrend on daily chart. MACD has positive divergence and RSI is rising on daily chart as well. as long as BTC remains bullish, I highly believe sushi will be bullish as well. If sushi reaches the resistance level around 9 dollars, that would be around 50% gain. If momentum is strong enough, more potential gain could be possible. However, take into consideration, we just had the fed talk, there is still some possibility for fluctuation. Be mindful of the risk. Not a financial advice.

SUSHIUSDT - May dip down to $4.9 once againHi, iJustCoiners!
SUSHI looks topped out at the current daily swing.
Looks like we will a have a downward momentum again very soon.
So there is a great opportunity for a short trade.
Please, support this publication with your likes and subscriptions!

Good time to invest in SUSHIHello traders!
Sushi is forming Lower low>Lower High pattern since 3rd Nov, once it breaks any of the Lower High it will pump.
I am expecting at least 100% of the investment from Sushi within few weeks.
The S/R level in the middle will help the Sushi to push higher.
Don't forget to hit the like button and follow to stay conncted.

SUSHI, short and many opportunities.The following content is machine translation:
Break through the downtrend line on the daily line.
MACD golden cross on the indicator.
In line with the market is much shorter. The upper resistance is near 8.
Break through 8 to increase the position, and reduce or clear the position in case of obstacles.