STC Saudi Telecom Weekly chartmotive move 1,2,3,4 and 5 clearly finished
now the market playing A,B and C corrective wave
I draw a zone between 0.618 -0.785 FIB of the motive wave
and compared with measured move
I expect the STC stock price to revers in the zone
good luck trade safe
7010 trade ideas

STC in KSA , 7010Technical analysis of the Saudi Telecom Company STC, subject to error and correctness. Just a simple look and analysis, not a recommendation to buy or sell.

TARGET REACHED ON 7010A trade I shared to the public at the same time I gave it to my clients have reached the target a month ago.
A trade that lasted for 2 month with a return of 300% of the amount invested.
These are the kind of the trades I give to my clients to make them satisfied of my service and make them safely invest and learn.
Follow for more!

STC: 85 CALENDAR DAYS PATTERN7010:STC has followed a pattern since the end of February 2023. Upon hitting the bottom trend line, Price appreciated 15-25% in 85 calendar days. This pattern has repeated 3 times over the last year.
Based on above observation, a long position can be opened once price hits the bottom trend line again.
TP1: 15%
TP2: 25%
OR simply close the trade on the 85th day of starting the trade
SL: 2% (just under the bottom trend line)
Keep waiting and hope the price comes back to the bottom trend line soon. Best of Luck!!

STC W1 Wave AnalysisSTC W1 Wave Analysis
we are in wave Y in downtrend or wave 2 from 3 in uptrend.
Regards,

7010 STC W1 (Trend & Volum) - TASI Market7010 STC W1 (Trend & Volum) - TASI Market
We are in downtrend with high sales momentum.
Regards,

7010 FILLED THE ORDER AND HEADING TOWARDS THE TARGETDear Saudi traders,
Some days ago, I posted to buy 7010 at 39.35, the price came filled the order and now heading towards the target.
Follow for more!

BUY 7010You can BUY on 7010 at 39.35 in a level where the market is done with filling the Gaps we have in the movement and done with grabbing the Liquidities we have on the past movement.
You can BUY with the target at 44.10 and the stop at 37.85.
Follow for more!

SAUDI TELECOME The weekly chart of Saudi Telecom shows move up. After break out golden point, will be continuing move up to hit the target.

Saudi Telecom Company (STC): A Promising Investment OpportunitySaudi Telecom Company (STC), a dominant player in the telecommunications sector, has experienced a recent correction in its stock price from a high of SAR 43 to the current level of around SAR 35. Market analysts identify an interesting entry level for STC between SAR 32 and SAR 34, offering potential investors a compelling opportunity to capitalize on the company’s robust market position and future growth prospects.
Additionally, STC offers an attractive dividend yield of approximately 7.08%, making it an appealing choice for income-focused investors. With its extensive infrastructure and commitment to innovation, STC remains well-positioned to benefit from the growing demand for digital services in Saudi Arabia and the broader region. Investors should consider this correction as a strategic entry point to gain exposure to a leading telecommunications provider poised for continued expansion and profitability

7010 IS STILL GOING DOWNLast week I posted not to buy 7010 since it is continuing its way down to fill the gaps we have in the market.
Now as you can see the market is approaching to the level it will pullback on, and that doesn't mean that it's time to buy since we must wait for some conditions to be met before we decide if we buy or no.
For more questions, don't hesitate to ask!

A technical look at the stock chart for STC Saudi ArabiaTechnical analysis indicates that STC stock may decline soon
This decline confirms the formation of a negative technical pattern on the monthly and weekly frames, and it is expected to visit the area marked in white to complete the objectives of the descending wave. TADAWUL:7010

DON'T BUY 7010I got asked too many times about 7010 if there's a possibility to buy it, as I recieved many messages from people who have bought in the wrong timing.
As you can see on the chart, the structure of the market shows that it will keep pushing down toward the 34.90 level. which means there's no point of buying it currently and risk your money. Instead you can buy on the other markets in which you got good opportunities.
For further questions, don't hesitate to ask!

7010 Saudi Telecome It is expected that the price will move up to 43. This is considering the wyckoff structure being fomed. I will be in on opening. :)

saudi telecom:Saudi telecom: no indication yet to reverse up so high probability that this market will keep drowning for now

BUY 7010Dears Saudi Traders and Investors,
I'm sharing with you one of the trades I gave to my private community,
As you can see on the chart, the price is now heading up after the pullback it made on the support level at 40.70.
You can buy and set you SL and TP on your own risk.
Son't hesitate to ask for further questions!

saudi telecom 7010we think long about this stock
estimated time and price of this stock the next two weeks of February
so we think 44 is our target

7010| 7010STC
Next target 46
In the chart:
Green is your next target and resistance
Red is your support
Good luck!

STCThe company is performing exceptionally well in financial terms. Currently, the stock is exhibiting a strong upward trend. My initial target is to reach 44, after which I will provide further updates.
DR SAUD

Observation weekThe brice reached to supply zone, and its the same area of the neck line that it broke it down before, the brice at 41.30 made support area before but now its resistant one, now we just need to observe for the current weekly bar if it will maje bearish bin bar ( especially if the brice closes lesser than 41.2) adding to observe stochastic RSI if it will make negative cross especially that it is in overbought zone now.
The first goal is 38.25
The second goal is 36-37
The last goal is 34.7
To know the importance of the 41.3 area, Follow the orange horizontal line

7010 IS CONSOLIDATINGDear Saudi Traders and Investors,
As you can notice on 7010 chart, the market currentlt is in a consolidation area, before you decide if you can buy or sell the market must get out of the area first then you can take your chance.
For further questions don't hesitate to ask!

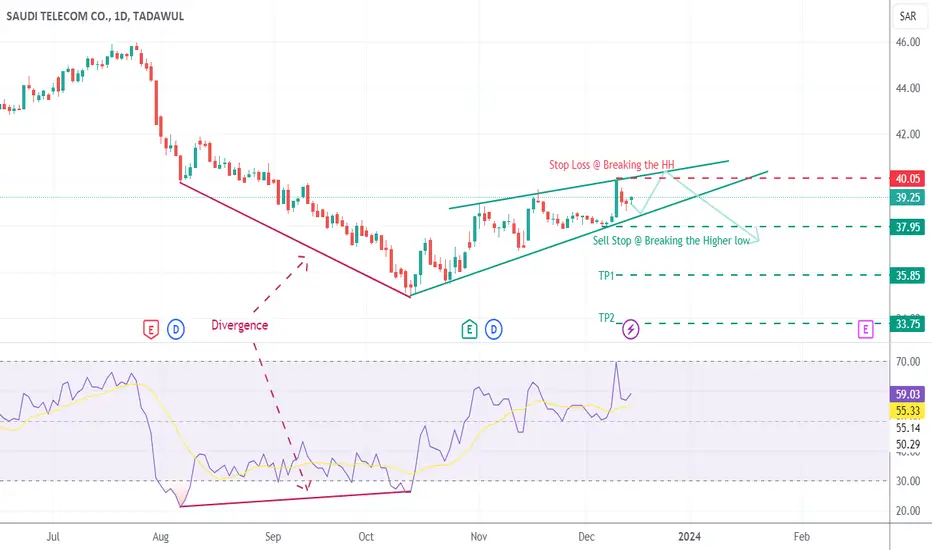
7010 Saudi telecom co. Printing Rising WedgeSTC @ Tadawul printing bearish Rising edge on Daily TF
EP, SL, and TPs marked on Dow Theory
7010Saudi Telecom limited is currently testing trend line and RSI pulled back from 30 level. Can be considered for a long position with stop loss below 35 (break of trend line)
