TAO early reversal bounce
TAO is bouncing from $360, potentially forming a higher low on 1H.
Once we cross $417 and 9 EMA crosses above 21 EMA, chance to run to $460, which marks the top of the prior range where TAO previously faked out after its run to $530. I'd enter on reclaim of 9 EMA.
Trade ideas

$TAO Long 🟩 Entry Zone: 330$ - 320$
🎯 Targets:
1️⃣ 345$
2️⃣ 360$
3️⃣ 380$
4️⃣ 400$+
🔻 Stop-Loss: Below 305$

TAO/USDT — Bearish Structure Broken, But Can Support Hold?After months trapped beneath a major descending trendline, TAO finally broke out with strong bullish momentum — hinting at a potential trend reversal.
However, price has now pulled back to retest the golden zone (386–355), which serves as the final defense line for the bulls.
This yellow zone is more than just a support area — it’s the intersection of horizontal support and the old downtrend line, making it the most decisive structure on the current chart.
In simple terms: this is where conviction meets fear — the battlefield between buyers and sellers.
---
🟢 Bullish Scenario
If the price holds firmly above 386–355 and forms a clear bullish rejection or engulfing candle, it would confirm strong buyer presence and likely trigger another leg up.
Bullish confirmation: 2D candle close above 415–430.
Upside targets:
🎯 464 → first resistance & partial profit zone.
🎯 561 → key supply area & mid-range target.
🎯 698–744 → swing target & major resistance zone.
A clean breakout above 430 would signal that the bearish market structure has been fully broken, paving the way for sustained bullish momentum.
---
🔴 Bearish Scenario
If the price fails to hold 355 and closes below it, the bullish structure becomes invalidated, opening room for a deeper retracement toward 330–290.
Such a move would confirm that the previous breakout was just a classic bull trap, where liquidity was swept before resuming the dominant downtrend.
Bearish continuation would be reinforced by increasing sell volume and lack of any strong bullish reaction around the support zone.
---
📈 Technical Structure Overview
Dominant pattern: Descending trendline breakout + retest confluence support.
Mid-term bias: Neutral–bullish while price stays above 386–355.
Momentum: currently consolidating — potentially forming a base for the next expansion phase.
Market psychology: bulls are being tested — holding this zone keeps the bullish structure alive; losing it gives bears back control.
---
⚙️ Trading Plan
Conservative entry: wait for a 2D close above 415 for confirmation.
Aggressive entry: accumulate within 386–355, stop loss below 350.
Targets: 464 / 561 / 698.
Risk-reward: favorable setup (1:3 – 1:5) if the bullish scenario plays out.
---
🧠 Conclusion
TAO stands at a decisive crossroads.
The 386–355 golden zone is not just technical support — it’s the psychological frontier between hope and fear.
As long as this zone holds, the bullish narrative remains alive.
But once it breaks, the bears will take command again.
Whichever direction wins, this is the most important battleground for TAO this quarter.
#TAO #TAOUSDT #CryptoAnalysis #Breakout #SupportResistance #TrendlineBreakout #PriceAction #SwingTrade #TechnicalAnalysis #CryptoTrading

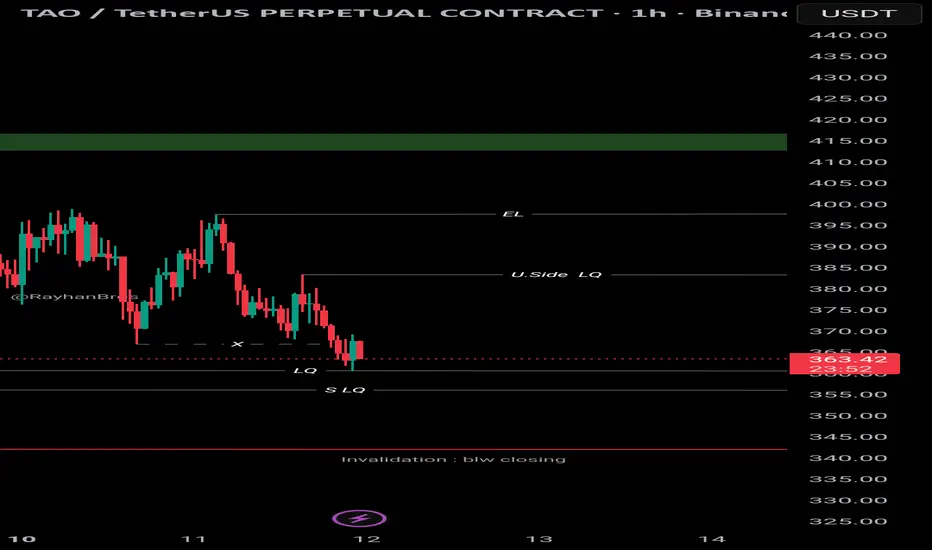
$TAO scalping Plan and Long Set-up GETTEX:TAO just made a solid pullback, and now I’m expecting a bounce. Most of the 12h downside liquidity has already been taken, and fresh liquidity is building on the upside all the way to $415.
🟢 Entry : 363$ & 355$
🎯 Targets : 372$ - 383$ - 395$ - 415$+
🔴 Stop : if closing Blw 338$ thn manually close....
If TAO can hold above $355, then a move toward $400–$415 looks likely
TAO Update📊 TAO Update
TAO is testing a major support level 🔵
If it holds this zone, a strong rebound could follow 📈
But if it breaks below, it may confirm further downside momentum ⚠️

Lingrid | TAOUSDT Support Zone Dip Buy OpportunityBINANCE:TAOUSDT is rebounding from the support level after a compression pattern near the lower boundary of the structure. Price is forming a contracting range with higher lows suggesting early accumulation within the broader ascending structure. A confirmed breakout above 380 could open the path toward 440. A bullish continuation remains favored while 330 holds as structural support.
⚠️ Risks:
A breakdown below 330 could invalidate the bullish bias.
Weak market momentum or Bitcoin correction could limit upside extension.
Rejection near 400 might trigger another retest of the support base.
If this idea resonates with you or you have your own opinion, traders, hit the comments. I’m excited to read your thoughts!

TAOTao is a good project and as i see it rn it is under accumulation from the whales, i know some of them that are rn buying in silence.
For me at this moment it is unclear yet the vision of this project as it regards the time when will explode, but i will monitor it and then i will enter.
2ND option has 30% of chance to happen, so it remains the 1ST Option to jump in, but not yet.
NFA
DYOR

TAO in flow — will it rise or slow? TAO surprised me a bit this time — after it broke the invalidation zone I mentioned in my earlier post about this coin, it’s now hinting at another potential upward move.
As usual, I’m watching a few possible scenarios — marked by the orange and purple arrows on the chart.
🎯For now, my short-term target is around $426, and globally, I’m keeping an eye on $500 🚀
❌The invalidation zone remains at $369.34.
⚠️ Disclaimer: This analysis is not financial advice or a signal to take action.
Always make trading decisions based on your risk management, and never trade without stop-losses.
💬 What do you think — will TAO continue to grow, or is it just a temporary bounce?
Share your thoughts in the comments.
📈 Follow me for updates on TAO and other crypto analyses.

TAOUSDT.P — Bittensor — Liquidity Sweep Loading — Watch the $340GETTEX:TAO 1H — Bittensor
Price just swept below Monday low and is now sitting right above the previous swing low / liquidity pool (~341.7) — aligning with Value Area Low, POC confluence, and stacked 8H–5M FVGs inside the deep discount fib pocket (0.618–0.705 → 0.786–0.886).
This area represents a prime liquidity sweep + accumulation zone.
Expect possible stop flush below 340 into the 0.786–0.886 “sweep zone”, then a sharp reclaim if buyers step in. Notice that there is also a psychological $300 price level in the sweep zone.
Reclaim of the 0.705 fib + SR flip (~355–360) would confirm structural shift and open a move toward Daily FVG 360–385, potentially even the 8H FVG 400–420 if momentum builds.
Fail to hold the 340 level → next liquidity shelf sits near 320.
Watch 5M structure and RSI behavior for early confirmation and of course HTF bullish divergences.

TAOUSDT.P - November 3, 2025TAOUSDT.P is displaying a corrective rebound within a broader downtrend, with price approaching the $470.53 buy limit zone. The setup suggests a potential continuation higher from this demand area, targeting $492.79 for partial profit and $499.37 as the final objective. The stop loss is positioned below the $456.66 support, defining a clear invalidation level. A sustained move above $470.53 would confirm bullish momentum and favor a continuation toward the upper targets, while a breakdown below $456.66 would negate the setup and open room for further decline.
Risk Assessment: Moderate risk — the trade depends on a successful defense of the buy limit, but the recent bullish push adds credibility to a short-term recovery.

TAOUSDT UPDATE#TAO
UPDATE
SOPH Technical Setup
Pattern: Bullish Falling Wedge Pattern
Current Price: $488
Target Price: $640
Target % Gain: 31.15%
GETTEX:TAO has successfully broken out of a bullish falling wedge pattern on the 1D timeframe. The breakout confirms renewed bullish momentum, suggesting potential continuation toward the $640 target zone — representing roughly 31% potential upside from current levels.
Time Frame: 1D
Risk Management Tip: Always use proper risk management and consider partial profits at key resistance levels.

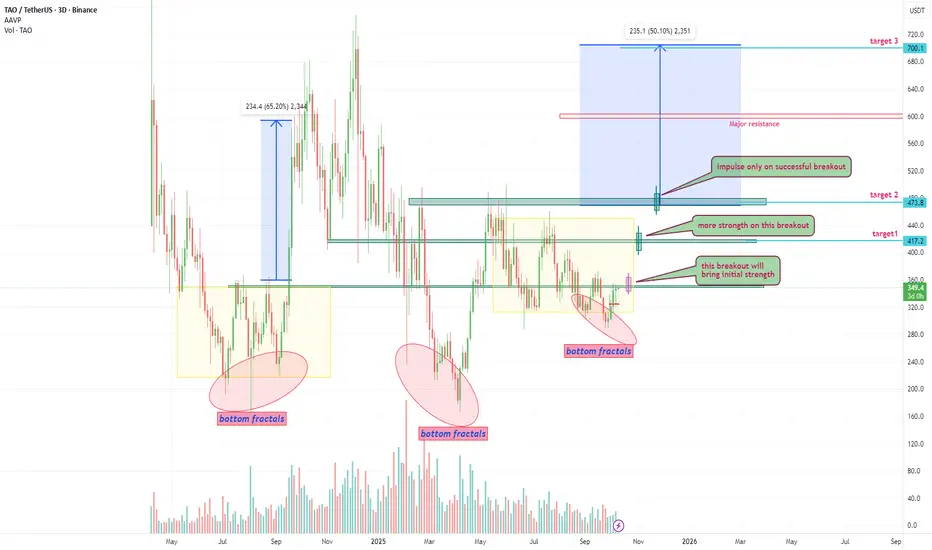
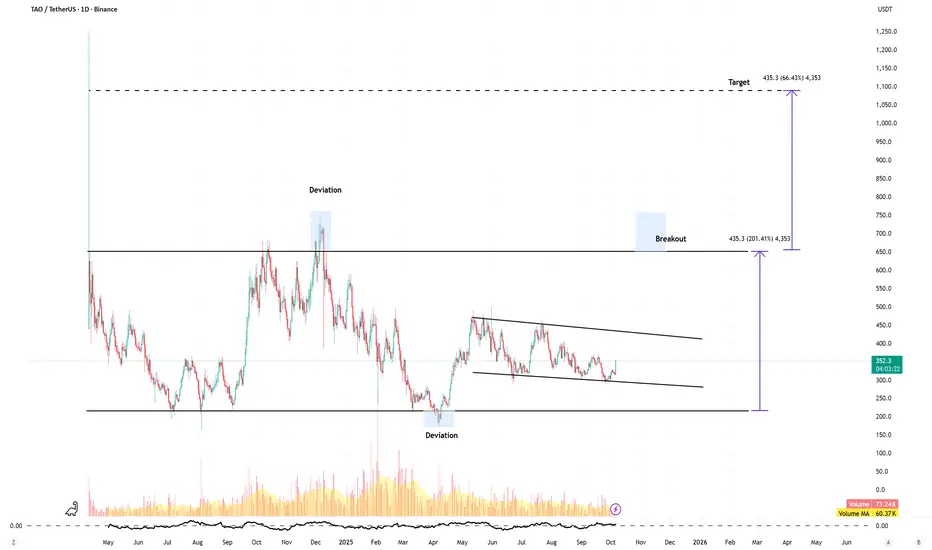
TaoUsdt respecting structure beautifully and breakout soonHI everyone,
Today its Bittensor Tao technical analysis.
The structure is very clear and easily visible on chart.
First, second and third breakouts mention with candle bodies closing above strong resistances.
Targets mentioned as well.
I think its has successfully found a low against btc or very close to.
Yellow zones are previous accumulation ranges and current accumulation ranges.
i have also mentioned bottoming fractals as per previous fractals
Rsi on 3d timeframe is almost close to breakout of its trendline.
At the moment, we are waiting for first breakout to enter the trade.
Not a financial advise just my thoughts
Previously i have picked up some great moves as you guys can see in my previous post.
Please like and subscribe for more analysis
have a great day and best of luck
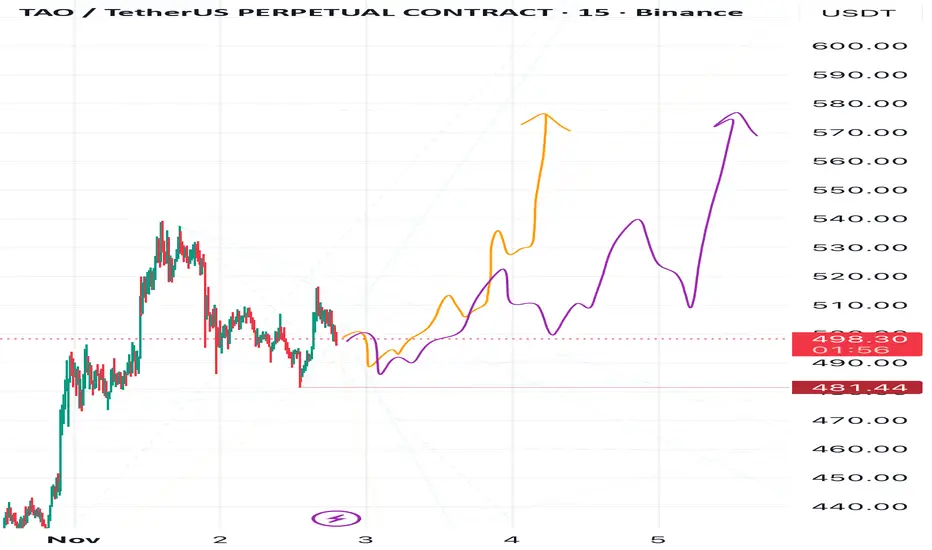
TAO to Glow — Just Like DASH FlowTAO is showing a price structure very similar to DASH, which makes me expect a strong upward move ahead.
I currently see two growth scenarios for TAO — following the purple and orange arrows on my chart.
Both lead to the same target zone:
🎯 Target 1: 580
🎯 Target 2: 640
🎯 Target 3: 720
❌ Invalidation Zone: 481.44
Both scenarios remain valid unless the price closes below that red level.
🚀 If you want more forecasts — leave a reaction!
🔔 Follow me so you don’t miss my daily updates — I post new analyses almost every day!

$TAO 1hGETTEX:TAO 1H
Beautiful falling channel breakout forming right at key support with clear upside targets (T1–T3).
If CRYPTOCAP:BTC stays stable and continues to perform well, this setup could easily push higher toward resistance. 📈

Buy TAO
🔹 What is Bittensor?
Bittensor is a blockchain-powered, open-source protocol that builds a decentralized marketplace for machine learning (ML) and AI models.
🔹 Why It Matters
AI + Blockchain Fusion: TAO sits at the intersection of two of the biggest narratives: artificial intelligence and decentralized infrastructure.
Subnet Architecture: Each subnet specializes in a type of AI task (language, image recognition, recommendations, etc.), creating a modular AI ecosystem.
Scarcity & Halving: Similar to Bitcoin, TAO has a halving cycle. The next one is due Dec 2025, cutting daily emissions in half.
Narrative Tailwind: As regulators and businesses question centralized AI control, decentralized networks like Bittensor gain attention.
Disclaimer:
This analysis is based on my personnal views and is not a financial advice. Risk is under your control.
TAO / USDT gaining momentum- Eyes on $700-$750 zoneTAO is looking strong and showing good momentum for a bullish rally towards the $700 – $750 range in the coming days.
Trend structure remains positive — watch for continuation signals and manage risk wisely.

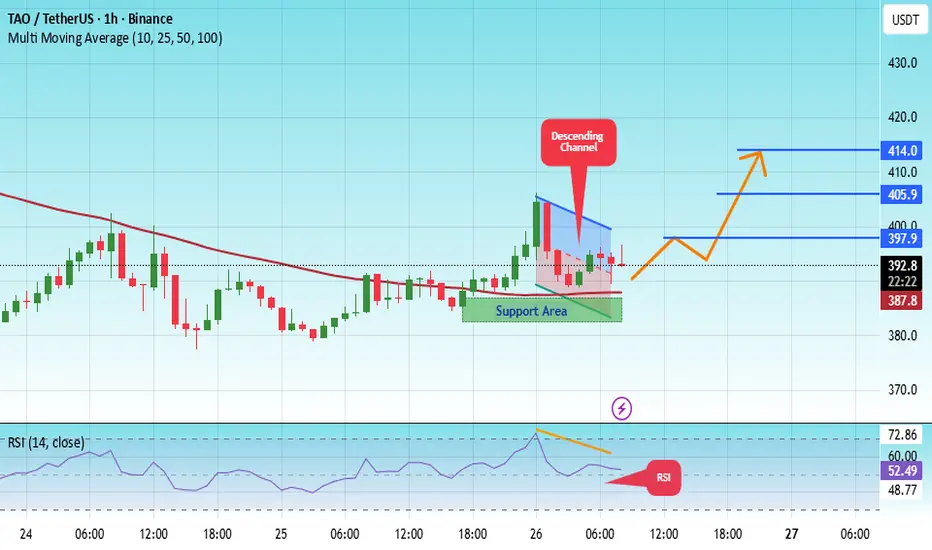
#TAO/USDT ranges for long term break out#TAO
The price is moving within a descending channel on the 1-hour frame, adhering well to it, and is heading for a strong breakout and retest.
We have a bearish trend on the RSI indicator that is about to be broken and retested, which supports the upward breakout.
There is a major support area in green at 385, which represents a strong support point.
We are heading for consolidation above the 100 moving average.
Entry price: 393.3
First target: 397.90
Second target: 405.90
Third target: 414
Don't forget a simple matter: capital management.
When you reach the first target, save some money and then change your stop-loss order to an entry order.
For inquiries, please leave a comment.
Thank you.
TAOUSD bullish scenarioTAOUSD is breaking the resistance, Im looking for 3 areas, price can hit.
Those areas are R?S and are in confluence with fibbs.

TAOGETTEX:TAO is positioned for a potential 115% gain within the next 93 days. The AI sector is showing renewed momentum, and GETTEX:TAO ’s strong fundamentals, liquidity profile, and positioning within the narrative suggest it could lead the next leg of sector expansion.

Flat Top BaseTAO looking to breakout here. Relative strength post flash crash and pushing to new highs. AI tailwinds given x402 protocol launch.

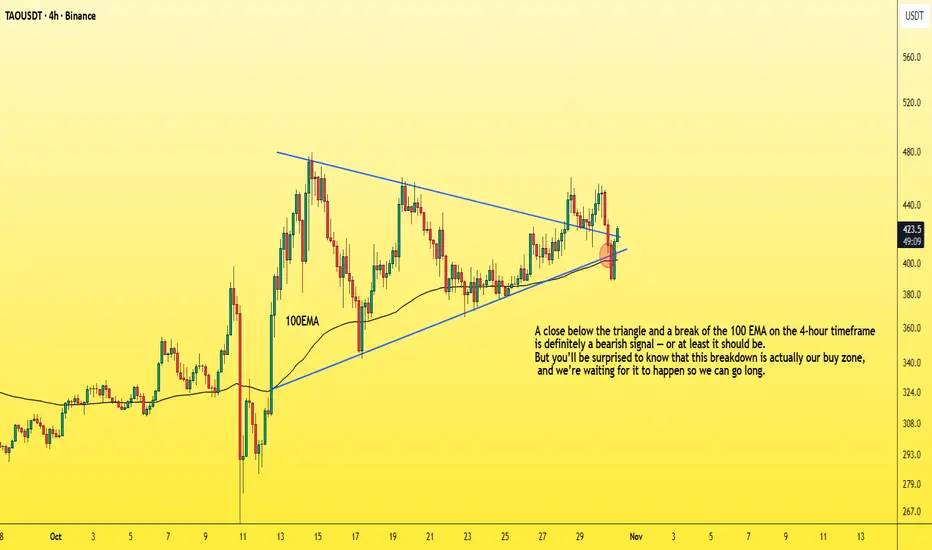
How to enter a successful futures tradeDrop everything and let me show you how to enter a successful long position with the lowest possible risk.
You need to understand that the market maker usually acts against us at major support areas on the chart — like the 100 EMA, 0.618 Fibonacci level, or a trendline.
To make this clearer, let’s take TAO as an example and I’ll explain why.
TAO has strong momentum and a large market cap,
so don’t apply what I’m about to say to meme coins, for example.
Now let’s go step by step on how to enter a futures position after choosing the coin 👇
1. First, wait for a bullish pattern to form — like a triangle — and for the coin to break it upwards with increasing long momentum.
2. The price will then retest the trendline, encouraging people to enter with larger positions, and those who missed the first breakout will likely place buy orders at the retest zone.
3. Then, the market surprises them — it drops back inside the triangle, giving a small bounce at the lower side.
4. But it doesn’t stop there — it continues dropping, breaking below the triangle and closing below the 100 EMA on the 4-hour chart.
This makes you panic and close your long position.
Others start entering shorts thinking it’s a real breakdown.
5. That’s when the market reverses sharply upward,
trapping short traders in losses,
while long traders who exited too early also lose.
In the end, only those who placed buy orders slightly below the strong support level (not directly on it, like under the 100 EMA) — and of course the market maker — end up winning.
So basically, the long traders lose, the short traders lose,
and only a small percentage of smart traders and the market maker win.
Small things to pay attention to 👇
-Your entry point should be slightly below the support, not too far below it.
(That support could be the 100 EMA, below the triangle pattern, or the 0.618 Fibonacci level, as we mentioned.)
-Don’t use high leverage — x5 should be your maximum.
-Place your stop loss 5% below your entry zone,
which equals about 25% loss if you’re using x5 leverage.
And with that, you’ve got yourself a long setup with over a 90% success rate,
and you can apply the same logic in reverse when taking a short position.
Best Regards:
Ceciliones🎯
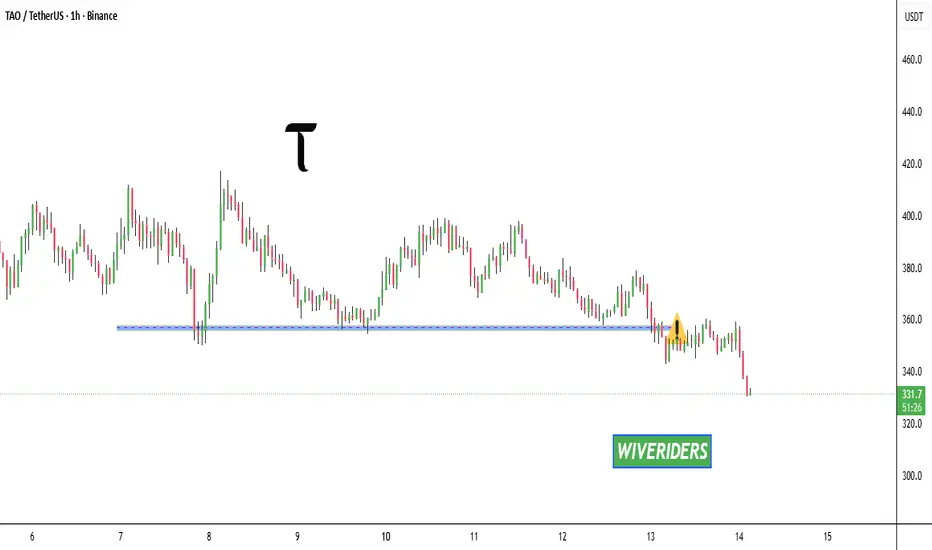
TAO Update📊 TAO Update
As we expected, TAO has broken below the blue support level 🔵
This confirms weakness in the structure and could signal a bearish move ahead 🔻