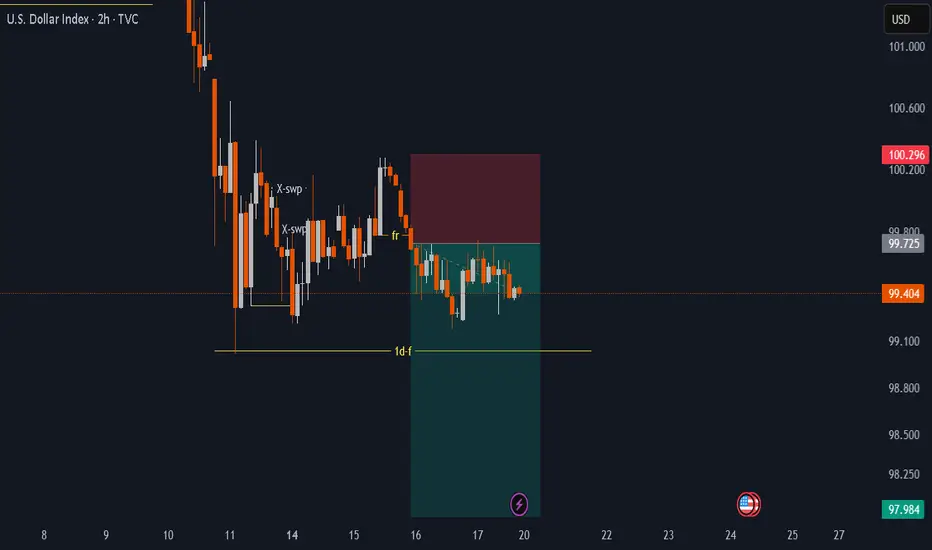
DXY update.
WEEKLY TREND IS SUPER BEARISH.
1D swing , and 1D fractals both structures are bearish.
in 2h tf -> price gave 1st fakeout then took out liquidity, and later it gave
fractals shift .
So to conclude:
I'm BULLISH in XXX / USD pairs and vice versa.
USDINDEX trade ideas
Dxy monthly analysis The dollar will fall to unprecedented levels due to several stupid policies, in addition to the US debt disaster. This is a medium- and long-term analysis using Elliott Waves, in addition to expected liquidity zones. Finally, I would like to ask: Is this the end of the dollar with China's increasing rise, or is this the beginning of preparations and selling by the major players in preparation for World War III, which will occur in 2027 or perhaps sooner?

I've Cracked the BULLISH Code in Dollar IndexDollar Index is setup for longs based on COT and other fundamental underlying conditions.

DXY: Local Bullish Bias! Long!
My dear friends,
Today we will analyse DXY together☺️
The recent price action suggests a shift in mid-term momentum. A break above the current local range around 99.390 will confirm the new direction upwards with the target being the next key level of 99.627 and a reconvened placement of a stop-loss beyond the range.
❤️Sending you lots of Love and Hugs❤️

DXY zoomed outBear Flag with price target breaking larger bear flag. Could this actually mark the dollar top for a long time?
Not financial advice

DXYElement: Details
Trend: Bearish on Daily
Bias Zone: Resistance at 100.160 (Monday high)
COT Timing: Tuesday close used for sentiment anchor
1H Pattern: M-Pattern confirming rejection
Target: 99.200 (Monday low - key support)
Outcome: Target hit on Wednesday

Altseason and a Weak Dollar — Will History Repeat in 2025?The altseason of 2017 started at the same time as the U.S. dollar index (DXY) began to fall. This likely helped bring more money into the crypto market. In 2020–2021, a similar thing happened: the falling dollar was followed by a strong rise in altcoins. But that time, altseason started closer to the end of the dollar’s decline.
A weaker dollar makes risky assets like crypto more attractive. In April 2020, the total crypto market cap was around $218 billion. Today, it’s about $2.63 trillion — around 12 times bigger.
However, to start a new altseason now, the market may need a lot more cheap money than in 2020. I’m not sure if the 2025 altseason can be as strong as in the past.
Now it seems that the only way to repeat that success is if a big part of the capital moves from Bitcoin into altcoins. This would need a sharp drop in Bitcoin dominance. But this brings new questions. After the launch of Bitcoin ETFs, the ownership structure has changed. Many people now own Bitcoin through investment funds, not directly. These funds may not be very excited to invest in altcoins.
What do you think about it? Share your opinion in the comments.

USD index bearish trendThe analyst expects the correction to end when the USDX reaches a value of 101.800. This is the predicted target for the end of the "C" wave of the correction. Once the index hits 101.800 (according to this analysis), the correction is expected to be complete, and the USDX may then resume its previous (likely upward) trend.
In short: The USDX is expected to fall to 101.800 to finish a temporary price dip (correction) that's shaped like an ABC pattern.

DXY Is Bullish! Buy!
Take a look at our analysis for DXY.
Time Frame: 9h
Current Trend: Bullish
Sentiment: Oversold (based on 7-period RSI)
Forecast: Bullish
The market is on a crucial zone of demand 99.408.
The oversold market condition in a combination with key structure gives us a relatively strong bullish signal with goal 101.388 level.
P.S
Please, note that an oversold/overbought condition can last for a long time, and therefore being oversold/overbought doesn't mean a price rally will come soon, or at all.
Disclosure: I am part of Trade Nation's Influencer program and receive a monthly fee for using their TradingView charts in my analysis.
Like and subscribe and comment my ideas if you enjoy them!

DXYBased on 6 consecutive bearish Commitment of Traders (COT) the US Dollar Index (DXY) is exhibiting a sustained bearish momentum, potentially indicating a decline in the US dollar's value relative to other major currencies.

check the trendThe price is expected to change the trend in the current support range and we will witness the start of an upward trend.
If the price breaks through the support range, the continuation of the downward trend will be likely.

Global Market Overview. Part 1: USDXThe Dollar Index is drifting at the key 99.5 mark. This strategic support level, which has held since early 2024, is on the verge of collapsing.
Let’s be clear: this isn’t just about the strength of the dollar. What’s at stake is the monetary sovereignty of the United States, caught between inflation, politics, and election-season hysteria.
And make no mistake — this has nothing to do with technical analysis. What we’re witnessing is a fundamental fire, and Donald Trump and his administration are fanning the flames.
Powell: “Rates remain unchanged.” But for how long?
Just days ago, Fed Chair Jerome Powell delivered what seemed to be a firm message:
“We are in a wait-and-see mode. Cutting rates prematurely could do harm.”
“If inflation accelerates, more difficult decisions may follow.”
On the surface — classic hawkish rhetoric. But in reality, this isn’t resolve.
It’s a delay tactic. Even Powell admits:
“The labor market is walking a fine line.”
“Economic growth weakened in Q1.”
“Business sentiment is deteriorating.”
“Tariff policy could lead to stagflation.”
“Political pressure is mounting by the week.”
The Fed says, “It’s too early to cut rates.”
But the market hears something entirely different: “We’re getting close.”
Trump applies pressure
Ahead of the elections, Trump declares:
“If we don’t cut rates now, we’ll lose to China, Europe, and our own markets.”
This isn’t just campaign rhetoric. It’s an open challenge to the Fed’s independence.
And history already tells us what happens when Trump applies pressure — 2019 rate cuts proved he can break through Powell’s defenses.
What the charts are saying
The Dollar Index (USDX) is locked in a persistent downward channel.
The 103.0 support zone has been broken
The 101.17 level remains the final significant support
99.5 is already being tested as a potential sell-off trigger
Below that — only air until 98.0 and 97.5
The technical setup confirms a fundamental truth:
The market no longer believes in the dollar’s strength.
What if the Fed actually cuts rates?
If the Fed moves to cut, USDX will break below 99 and enter a systemic phase of weakening.
Capital will flow into gold (as if it hasn’t already gone far enough), oil, crypto, and high-yield emerging markets.
The United States will lose its competitive edge in monetary policy,
and the dollar will slowly cease to function as the global anchor it once was.
Powell can talk tough all he wants. The market is no longer listening.
The Dollar Index isn’t dropping because rates are already cut — it’s falling because everyone knows it’s just a matter of time.
U.S. monetary policy has lost the initiative, and market expectations have taken over.
Today, the Fed rate is no longer a tool of control. It’s a signal of approaching capitulation.
The question is no longer “Can we hold 99.5?”
The real question is: “What happens after it breaks?”
Manipulation or strategy? Black swans on a leash
Powell’s rate policy, DXY charts, inflation forecasts — all of it loses clarity when the dominant market force is no longer economics, but politics.
We live in an era where markets break not from bad data, but from tweets, briefings, and backroom deals — moves that only reveal themselves in the charts after the fact.
That’s what makes the current cycle the most toxic in the last 15 years.
Markets aren’t just volatile — they’ve become irrational.
Trade war: scalpel in a surgeon’s hand or a bat in a brawler’s grip?
Tariffs aren’t new.
But in Trump’s hands, they’ve evolved — from macroeconomic tools to blunt political weapons.
He uses them as battering rams — to force concessions, corner opponents, and set up ideal conditions for insider gains.
The market reacts exactly as you’d expect:
Tariffs announced — indexes fall
Panic ensues — capital flees into dollars and gold
Within 48 hours — videos surface of Trump and his allies joking about the “hundreds of billions” they made during the crash
This isn’t conspiracy.
It’s already triggered official investigations, but everyone knows: the odds of accountability are near zero.
And that’s the biggest risk for fundamental analysis today:
It’s powerless against narratives crafted behind closed doors.
So who’s really running the market?
Trump is deliberately deflating the bubble. Loudly. Dramatically. On camera.
But the goal isn’t destruction. It’s control.
And while Powell fears making a mistake, Trump fears only one thing — losing control of the narrative.
The market is no longer a field for rational actors.
It has become a battlefield, where officials already understand:
You can control more than just money through the market — you can shape public consciousness.
How not to lose your footing in this chaos?
We’ll break it down in the next part of the Global Market Overview. Stay tuned.

dxy-1Ddollar index has a bearish gaurd to close it's cycle and sweep the liquidities to provide its fuel to form new HHs...

Key Support Level on DXY Index at 97-98In this analysis, I highlight the important support zone for the DXY (US Dollar Index) around the 97-98 level. Monitoring this zone is crucial for understanding potential price movements and trading opportunities.

USD Price Action Correlation with Bitcoin PriceIn the later stages of the liquidity cycle you have a devaluation of USD leading to bitcoin breaking out of its bullish trend into a parabolic trend.
-Last 2 cycles this predictive correlation leaded bitcoins breakout by 4 to 6 months.
-Current cycle DXY/Bitcoin charts look very similar to 2018
Taking this correlation into account, we could likely see the bullish trend on Bitcoin transform into a parabolic trend sometime between May and June. Meaning, we are in the final stages of a bottoming in Bitcoin at the time of this post, likely about to continue bullish momentum as we just went through significate market strain. Removing the possibilities of another Black Swan event, like a major geopolitical event but it is my belief that this was already priced in from the markets reaction just this month. This being said, there are no certainties. Things could always get worse. Time will tell, but given my aforementioned annalists, the buying opportunity at this current point is to great to ignore. Reward greatly outweighing the risk.

DXY(Dollar)Dollar is consolidating and its best to wait for it to break out of the high or low. As of now it is in ‘No Mans Land’.


DXY: Bears Are Winning! Short!
My dear friends,
Today we will analyse DXY together☺️
The in-trend continuation seems likely as the current long-term trend appears to be strong, and price is holding below a key level of 99.125 So a bearish continuation seems plausible, targeting the next low. We should enter on confirmation, and place a stop-loss beyond the recent swing level.
❤️Sending you lots of Love and Hugs❤️

USD Oversold on Weekly & Fibonacci Support TestWeekly charts can be helpful for tracking the motion of the ocean, or larger dominant trends. And so far in 2025, that trend has been quite bearish for the US Dollar and this showed up even with the Greenback coming into 2025 with a full head of steam.
But last week something that's somewhat rare showed up - as weekly RSI on DXY went into oversold territory for only the second time in the past seven years.
The last time this happened was August of 2024, and that was followed by the Q4 reversal in the USD. And before that - it was all the way back in early-2018, which is around when DXY marked a major low that still hasn't been traded through.
This isn't to say that RSI is an automatic indication of reversal because it's not - it's simply a lagging indicator that shows how one sided a trend has been of late. But - it does illustrate how chasing the USD lower could be a challenge here especially given how quickly bears have come on over the past couple of months.
There's also some Fibonacci support that's in-play which is very near support in the range of USD that held for a couple of years before the Q4 breakout. The 61.8% retracement of the 2021-2022 major move plots right at 98.98, which has so far held the lows in DXY.
Of interest and perhaps a bigger component of this move is whether EUR/USD will be able to establish a reversal at or around the 1.1500 handle. And that's a question mark right now, because from a data and driver perspective, it would seem that the backdrop is there as US retail sales printed with strength this week, and Chair Powell sounded somewhat hawkish around the prospect of inflation given the tariff situation. And then the ECB rate cut on Thursday sounded dovish - all factors that would normally be expected to push EUR/USD weakness.
The fact that it hasn't happened is of interest as this could be a bigger picture dominant trend showing it's hand. As I shared in the EUR/USD post which I'll link below, bulls are still in charge of the pair from a price action perspective so accordingly I would still assume bears are in-control of USD until evidence suggests otherwise. In DXY, it's the 102 level that I would like to see traded through as illustration of bulls taking control. -js

US exceptionalism is overwhat if te era of us exceptionalism is over.
The dollar will still be reserve curency but demand will be serverly cut, faith in the us fails and the dollar reprices back to where it was.
right now not looking great. im not call for death of the dollar just a repice back to normality
Dxy looks ike it could jsut sweep all the way back

Smart Traders Watch the Fed — Smarter Ones Watch the DollarHello Traders 🐺
In this idea, I decided to talk about the U.S. Dollar Index (DXY) — because so many people have been asking me:
“How do you predict the Fed’s moves, and how do they affect deflationary assets like BTC?”
My last idea was about BTC, where I explained why I believe a major bull run is coming — and part of that is because the Fed might soon shift back to QE.
But if you're trying to predict QE...
The first thing you need to watch is the U.S. Dollar Index, which reflects the strength of the U.S. Dollar.
So let’s break it all down:
🔍 Part 1: What Does the Fed Actually Do?
The Fed isn’t just a printer — it’s the U.S. central bank, and it has a dual mandate:
✅ Keep prices stable (control inflation)
✅ Promote maximum employment
That means the Fed doesn’t just want growth — it wants sustainable growth. No crazy inflation, no deep recession. Balance is key.
🧰 How Does the Fed Do It?
Through Monetary Policy, which is basically the toolkit used to control liquidity, interest rates, and economic behavior (like how much people borrow, spend, or save).
Let’s break down the main tools:
1️⃣ Federal Funds Rate
This is the most powerful tool the Fed has.
It’s the rate banks use to lend to each other overnight.
If the Fed raises the rate:
→ Loans get expensive
→ Spending slows
→ Inflation drops
→ But markets can crash
If the Fed cuts the rate:
→ Loans get cheaper
→ Demand rises
→ Growth accelerates
→ But inflation can surge
2️⃣ Open Market Operations (OMO)
This is how the Fed injects or removes liquidity using bonds.
Buys bonds → Injects money → 🟩 QE (Quantitative Easing)
Sells bonds / lets them expire → Removes money → 🟥 QT (Quantitative Tightening)
3️⃣ Reserve Requirements
This used to be a big deal — the % banks had to hold in reserves.
But since 2020, it's set to 0%.
4️⃣ Discount Rate
The interest rate the Fed charges banks directly.
A change here sends a strong signal to the markets.
Sometimes the Fed also works in sync with the U.S. government — using fiscal support like:
💸 Stimulus checks
🏢 Corporate bailouts
🧾 Tax relief packages
📈 So... Why Does the Dollar Index (DXY) Matter?
There’s a very clear inverse correlation between the DXY and BTC.
When the dollar gets stronger (DXY pumps), BTC usually dumps.
Why? Because rising DXY often means:
🔺 The Fed is raising rates
🔺 Liquidity is being pulled out
🔺 QT is in play
Let me show you some real chart examples:
📉 July 2014 — DXY pumped → BTC dumped hard
DXY Chart:
BTC Chart:
➡️ Just a 28% DXY pump → 80% BTC crash. Ouch.
📈 2017 — DXY dropped → BTC entered full bull market
DXY Chart:
BTC Chart:
➡️ A 15% DXY drop → Bitcoin bull run of a lifetime.
Now here’s the good news 👇
DXY is starting to look very bearish on the chart:
Combine that with the Fed shifting to QE, and guess what?
We're likely entering the early stages of another bull market.
If you read my last BTC idea, you already know what I’m expecting...
🚀 A massive run is just around the corner.
I hope you found this idea useful, and as always —
🐺 Discipline is rarely enjoyable, but almost always profitable 🐺
🐺 KIU_COIN 🐺

Despite long-term support, the dollar is eyeing deeper watersAlthough the US Dollar (USD) Index has connected with a monthly support area between 98.72 and 99.67, April’s lower low at 99.01 reached levels not seen since early 2022 and price crossing below the 50-month simple moving average (SMA) at 101.91 potentially questions this support zone.
Bolstering the likelihood of additional downside in the USD are the daily and H4 charts. The former exhibits scope to reach support at 98.58 (and formed a Death Cross ), while the latter completed a bearish pennant pattern (ruptured the lower boundary), extended from 100.64 and 99.01. As you can see, H4 action is currently retesting the underside of the breached pattern’s border.
In view of the above technical surroundings, USD shorts could have some gas left in the tank.

USDX-BUY strategy 6 hourly chart Line Brk (2)The USDX is poised to correct, I feel. we are oversold, and it means we may be seeing a return back towards 101.50-101.75 area. this suggest all USD based currencies will correct one way or another.
Strategy BUY @ 99.30-99.80 and take profit near 101.50.
