TradeCityPro | TIA: Key Support Test in Cosmos-Based Token👋 Welcome to TradeCity Pro!
In this analysis, I want to review the TIA coin for you. This project is one of the protocols in the Cosmos ecosystem and currently ranks 53 on CoinMarketCap with a market cap of $1.51 billion.
📅 Daily Timeframe
As you can see on the daily chart, there's a descending tre

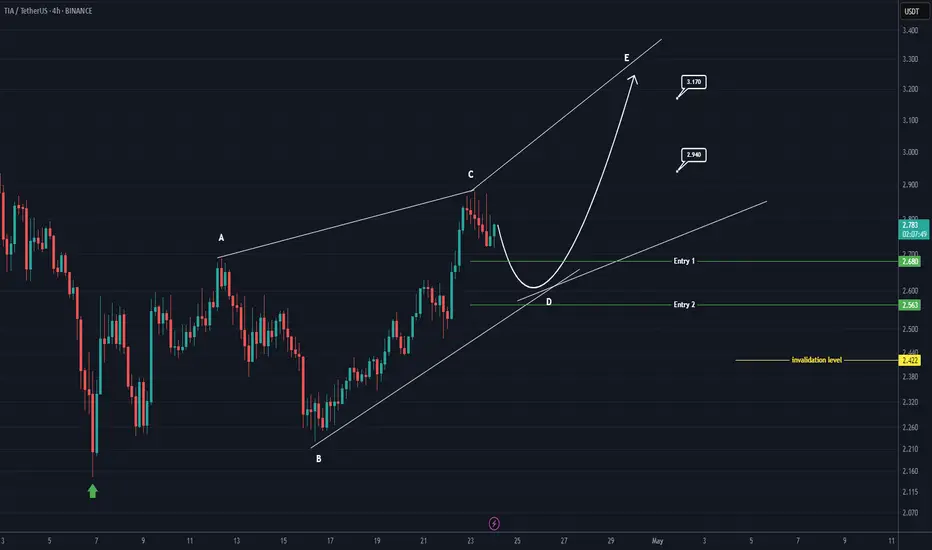
TIA buy/long setup (4H)TIA seems to be in the middle of a bullish pattern, especially as it has reclaimed key levels and there is an order block located below the current price.
Two entry points are marked on the chart, indicating where we’re looking for buy/long positions.
Targets are specified on the image.
A 4-hour
TIAUSDT 1D AnalysisTIA ~ 1D Analysis
#TIA Buy after successfully penetrating this resistant line with a short -term target of at least 10%+.

Tia short down to $2.28 todayJust now opened a short position on tia. I anticipate continuation fall towards $2.28
Time sensitive.
Stop and partials on chart

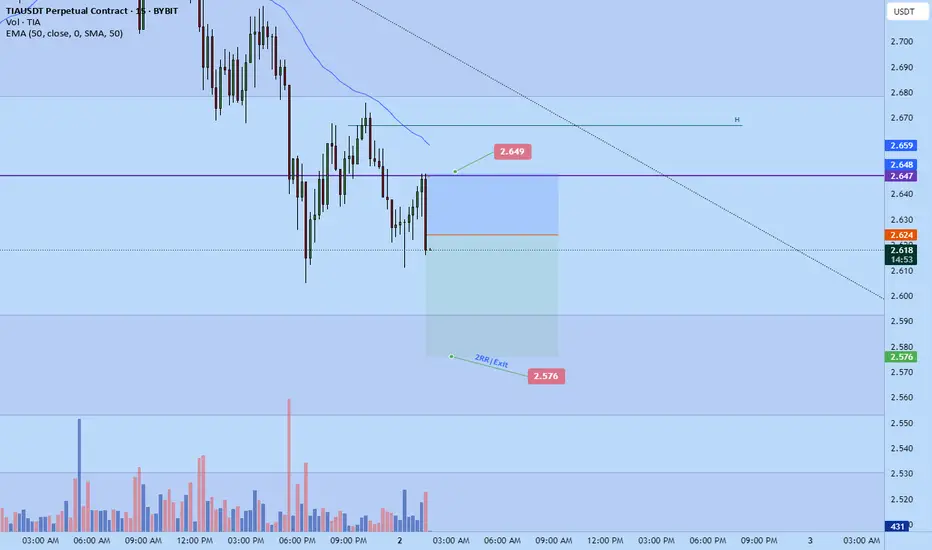
Tia scalp short to $2.576Just now opened a scalp short on Tia. Time sensitive.
2RR
Stop: $2.649
Target; $2.576
TIAUSDT UPDATE
TIA Technical Setup
Pattern: Falling Wedge Breakout
Current Price: $2.96
Target Price: $6.33
Target % Gain: 125.33%
Technical Analysis: TIA has broken out of a falling wedge pattern on the 1D chart, showing bullish momentum. Volume is picking up, confirming the breakout and a strong move towar

TIAUSDT — 2025 Technical RoadmapTIAUSDT — Daily Technical Roadmap
🕞 60-Second Read
Trend on the 1-D chart is still structurally bearish ; price (spot 2.865 USDT) just carved a higher-low off the 2.44 vector block and is knocking on the Yearly BC lid. Two large upside voids now beckon.
Hot-Zone #1 – 2.60 → 2.44 (1 D + 4 H

TIA : last dump before mooningafter analysis as described on the chart tia will vsiist the 1$ levels.
Place the trade as described in the chart :
i m not putting any stop lose :
i enter with 50% of the capital :
each small dump i add a 10% from the first capital so i have 5 more entries:
=======> this is not a financial advice

#TIA/USDT#TIA
The price is moving within a descending channel on the 1-hour frame, adhering well to it, and is heading towards a strong breakout and retest.
We are experiencing a rebound from the lower boundary of the descending channel, which is support at 2.18.
We are experiencing a downtrend on the RSI

TIA - Some Major LevelsTIA, i would call it for more Short purposes, but market sentiment can change really quickly.
If you wanna be on safer side, then trade it on retest of those levels.
12h: Bigger TL as R on Chart and on OBV.
1: Below an overview of Lines of 1h OBV.
Follow for more ideas/Signals.💲
Check out my p

See all ideas
Summarizing what the indicators are suggesting.
Oscillators
Neutral
SellBuy
Strong sellStrong buy
Strong sellSellNeutralBuyStrong buy
Oscillators
Neutral
SellBuy
Strong sellStrong buy
Strong sellSellNeutralBuyStrong buy
Summary
Neutral
SellBuy
Strong sellStrong buy
Strong sellSellNeutralBuyStrong buy
Summary
Neutral
SellBuy
Strong sellStrong buy
Strong sellSellNeutralBuyStrong buy
Summary
Neutral
SellBuy
Strong sellStrong buy
Strong sellSellNeutralBuyStrong buy
Moving Averages
Neutral
SellBuy
Strong sellStrong buy
Strong sellSellNeutralBuyStrong buy
Moving Averages
Neutral
SellBuy
Strong sellStrong buy
Strong sellSellNeutralBuyStrong buy
Displays a symbol's price movements over previous years to identify recurring trends.