TradeCityPro | TIA: Key Support Test in Cosmos-Based Token👋 Welcome to TradeCity Pro!
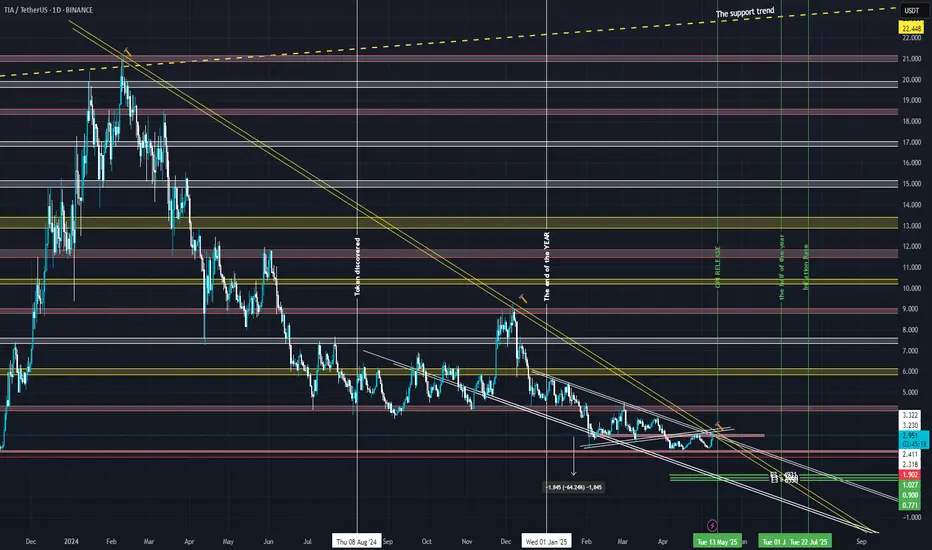
In this analysis, I want to review the TIA coin for you. This project is one of the protocols in the Cosmos ecosystem and currently ranks 53 on CoinMarketCap with a market cap of $1.51 billion.
📅 Daily Timeframe
As you can see on the daily chart, there's a descending tre

Celestia: Easy New ATH $33 & Mid-Term Target $14 (TAC-S6)Good afternoon my fellow Cryptocurrency genius, you have great timing and also a great choice here.
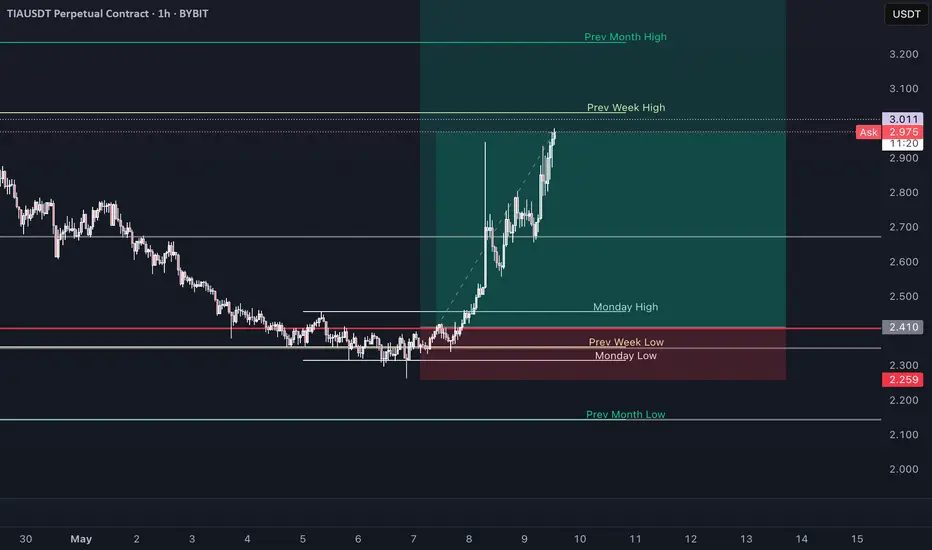
Celestia's bottom came in just a month ago, 7-April. This date is the same date when the entire Cryptocurrency market hit bottom, with some exceptions of course.
After the low 7-April TIAUSDT starts

TIA/USDT BULLISH reversal from Fibonachi GOLDEN ZONE📈 TIA/USDT – 4H Analysis (BINANCE)
🟢 Bullish Reversal Setup Identified
Price has tapped into the Fibonacci golden pocket (0.705–0.79) and shown a strong reaction from the demand zone at $2.32–$2.34. A clean bounce suggests potential upside towards the previous high at $3.03.
🎯 Trade Plan:
Entry:

Celestia is dumping before bulish seasonas described on the chart we will see the last bearish season to the the green zone before goin up as described
NOT FA DYOR
happy trading
TIA SIGNALSHello friends
As you can see, this currency has a beautiful chart and the technical analysis we did is that if the valid resistance is broken, we can open a buy trade with capital and risk management and move with it to the specified targets.
*Trade safely with us*

TIA Secondary trend. Wedge. Reversal zone. 09 05 2025Logarithm. Time frame 3 days. The price dropped to the listing price zone, namely the level of 2.309. In this zone, the decline stops and the transition to consolidation - sideways. The decline formed a full-fledged descending wedge. This is a bullish pattern in cases of a breakthrough of its resist

Celestia swing long tradeJust now opened this swing long trade position on tia. Didn't get the most sniper entry and there might be another correction but didn't want to miss it so decided to take a swing long position. Perhaps later on in time I'll scale in a bit.
Targeting $3.00 area
$2.369 stop or lower
Roughly 6RR.

TIAUSDT 2D AnalysisTIA ~ 2D Analysis
#TIA Buy gradually from here if you still have confidence in this coin with a short term target of at least 20%+ from here

TIA Breakout confirmed.Successfully breakout this resistant line with a short -term target of at least +10%

See all ideas
Summarizing what the indicators are suggesting.
Oscillators
Neutral
SellBuy
Strong sellStrong buy
Strong sellSellNeutralBuyStrong buy
Oscillators
Neutral
SellBuy
Strong sellStrong buy
Strong sellSellNeutralBuyStrong buy
Summary
Neutral
SellBuy
Strong sellStrong buy
Strong sellSellNeutralBuyStrong buy
Summary
Neutral
SellBuy
Strong sellStrong buy
Strong sellSellNeutralBuyStrong buy
Summary
Neutral
SellBuy
Strong sellStrong buy
Strong sellSellNeutralBuyStrong buy
Moving Averages
Neutral
SellBuy
Strong sellStrong buy
Strong sellSellNeutralBuyStrong buy
Moving Averages
Neutral
SellBuy
Strong sellStrong buy
Strong sellSellNeutralBuyStrong buy
Displays a symbol's price movements over previous years to identify recurring trends.