TIA infohere's my view on LSE:TIA in terms of T.A
use info to complement your own T.A
not to follow blindly
TIAUSDT.P trade ideas

TIA/USDTBINANCE:TIAUSDT
This idea has a medium-term profit target.
All targets are indicated on the graph.
- Risk 1% on deposit
- R/R 1/2
P.S (This is not an investment recommendation, this is my personal opinion.)

TIA is at the key Support zoneTIA is at the key Support zone
🔵Entry Zone 13.72 - 14.07
🔴SL 12.3444
🟢TP1 15.0352
🟢TP2 16.7800
🟢TP3 18.5288
Risk Warning
Trading Forex, CFDs, Crypto, Futures, and Stocks involve a risk of loss. Please consider carefully if such trading is appropriate for you. Past performance is not indicative of future results.
If you liked our ideas, please support us with your likes 👍 and comments.

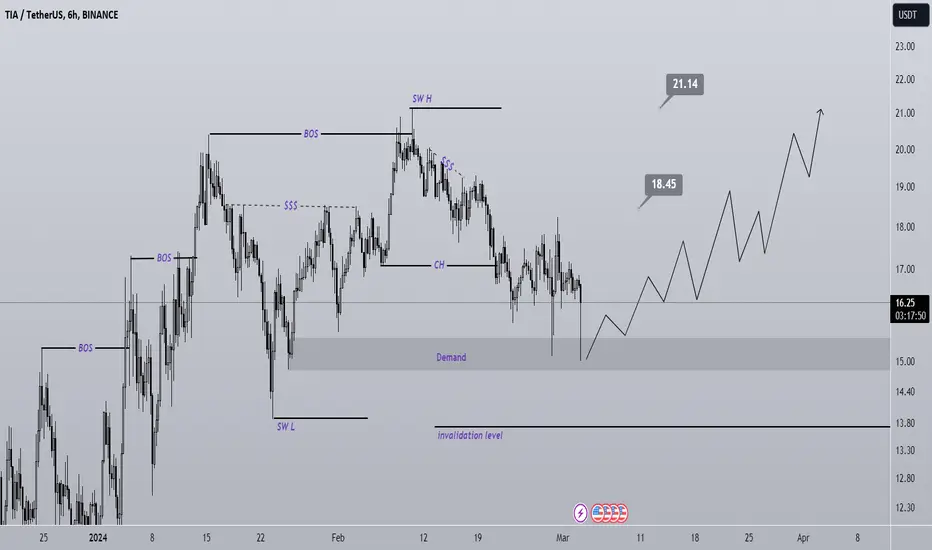
TIA has reached a valuable rangeTIA has reached a valuable range. By maintaining the specified demand, it can move towards the specified targets on the chart.
Closing a daily candle below the invalidation level will violate the analysis.
Note that the financial market is risky, so:
Do not enter any position without confirmation and trigger.
Do not enter a position without setting a stop.
Do not enter a position without capital management.
When we reach the first TP, save some profit and try to move the stop continuously in the direction of your profit.
If you have any comments please post them, comments will help us improve our performance
Thanks
TIA: buy in low level📊Analysis by AhmadArz:
🔍Entry: 15.79
🛑Stop Loss: 14.86
🎯Take Profit: 16.71-17.48-18.24
🔗"Uncover new opportunities in the world of cryptocurrencies with AhmadArz.
💡Join us on TradingView and expand your investment knowledge with our five years of experience in financial markets."
🚀Please boost and💬 comment to share your thoughts with us!


TIA: Trendline BreakoutTrendline Breakout ( Daily Chart ). Strength in the Background : Hidden Bullish Divergence.
.....................................................................................................................
We are not registered or licensed in any jurisdiction whatsoever to provide investing advice or anything of an advisory or consultancy nature.
and are therefore are unqualified to give investment recommendations.
Always do your own research and consult with a licensed investment professional before investing.
This communication is never to be used as the basis of making investment decisions, and it is for entertainment purposes only.

TIA ANALYSIS (6H)From where we entered start on the chart, we have had a symmetric, now we seem to be in the F wave of this symmetric, and it is expected to start from the green area of the bullish wave G of this symmetric and move towards the targets.
Closing a daily candle below the invalidation level will violate the analysis.
For risk management, please don't forget stop loss and capital management
When we reach the first target, save some profit and then change the stop to entry
Comment if you have any questions
Thank You

long TIACelestia broke through the short-term descending trendline. The bullish trend is expected to continue and reach the resistance level at $20.6


$TIA strong run until halvingI see the full crypto market to remain bullish until the halving. similar to Coinbase listing the halving will mark the pico top for this cycle. a good 30% correction all over the board and we continue the cycle later in mid year.

TIAUSDT.PHello Trader BINANCE:TIAUSDT.P
ihns potential wait for the green nickline area bounce to confirm the area, this can be used for spot as well because the 4-hour swing type candle chart, max target area 19.9660, and stop loss area 17.0337.
Please add a comment and Positive feedback and constructive criticism are important to authors and the community.
Disclamer: Not Financial Advice

now or never TIAseems like Tia make perfect correction from 10 Feb
in bull market expecting price go up from this level
15,63 Stop

✅ Tia token analyses for SPOT position✍️
Celestia is a modular layer one blockchain network designed to solve the scalability problem in blockchains.
⚡️By separating the consensus and execution layers, this network allows developers to easily launch their own blockchains without the need for in-depth specialized knowledge, with high security and scalability.
For this reason, it has been noticed and welcomed by many users and other projects and very good investments have been made on it🔥
According to the mentioned contents and the very bright history of Celestia, we can expect that investing in this currency will be profitable for us.
Currently, in the technical discussion, Celestia's main token named Tia has broken its trend line and resistance line, and at the price of 16.20, it can be a suitable entry for spot buying.
✅Investing in cryptocurrencies is always risky and requires your own research and personal capital management

#TIA/USDT lONG#TIA
The price is moving in a downward channel on a 1-hour frame
We have a breakout to the top of the Moving Average 100
The rise is expected to continue to complete the model based on 3 goals
Entry price is 18.25
First goal 19.07
Second goal 19.71
Third goal 20.39

TIA/USDT - TIA: BBand Breakout◳◱ On the $TIA/ CRYPTOCAP:USDT chart, the Bband Breakout pattern suggests a consolidation phase that could precede a trend continuation or reversal. Traders might observe resistance around 18.09 | 19.79 | 23.03 and support near 14.85 | 13.3 | 10.06. Entering trades at 17.31 could be strategic, aiming for the next resistance level.
◰◲ General info :
▣ Name: TIA
▣ Rank: 1897
▣ Exchanges: Binance, Kucoin, Bybit, Huobipro, Gateio, Mexc
▣ Category/Sector: N/A
▣ Overview: TIA project overview is currently unavailable. I'll try to update this in the upcoming analysis.
◰◲ Technical Metrics :
▣ Mrkt Price: 17.31 ₮
▣ 24HVol: 62,707,138.361 ₮
▣ 24H Chng: 0.232%
▣ 7-Days Chng: -17.13%
▣ 1-Month Chng: -41.32%
▣ 3-Months Chng: -43.37%
◲◰ Pivot Points - Levels :
◥ Resistance: 18.09 | 19.79 | 23.03
◢ Support: 14.85 | 13.3 | 10.06
◱◳ Indicators recommendation :
▣ Oscillators: NEUTRAL
▣ Moving Averages: STRONG_BUY
◰◲ Technical Indicators Summary : BUY
◲◰ Sharpe Ratios :
▣ Last 30D: N/A
▣ Last 90D: N/A
▣ Last 1-Y: N/A
▣ Last 3-Y: N/A
◲◰ Volatility :
▣ Last 30D: N/A
▣ Last 90D: N/A
▣ Last 1-Y: N/A
▣ Last 3-Y: N/A
◳◰ Market Sentiment Index :
▣ News sentiment score is N/A
▣ Twitter sentiment score is N/A
▣ Reddit sentiment score is N/A
▣ In-depth TIAUSDT technical analysis on Tradingview TA page
▣ What do you think of this analysis? Share your insights and let's discuss in the comments below. Your like, follow and support would be greatly appreciated!
◲ Disclaimer
Please note that the information and publications provided are for informational purposes only and should not be construed as financial, investment, trading, or any other type of advice or recommendation. We encourage you to conduct your own research and consult with a qualified professional before making any financial decisions. The use of the information provided is solely at your own risk.
▣ Welcome to the home of charting big: TradingView
Benefit from a ton of financial analysis features, instruments and data. Have a look around, and if you do choose to go with an upgraded plan, you'll get up to $30.
Discover it here - affiliate link -

Tia breakout levelI assume if TIA breaks out of this bearish price action, it will generate a bullish breaker. So far the price can hit the box above.
NFA


TIA/USDT breakout On March 5, 2024, TIA made SFP (Swing failure pattern) to take away stop losses and liquidity before making final leg excellent buy back and hold strong at current price is breaking out from 26 days downtrend and healthy correction targeting 23-25$ zone as final leg before proceeding to major correction.
stop loss 14.74$

TIA has formed a flag patternTIA has formed a flag pattern
🔵Entry Zone 16.30 - 16.85
🔴SL 14.8174
🟢TP1 17.9517
🟢TP2 19.8919
🟢TP3 22.0188
Risk Warning
Trading Forex, CFDs, Crypto, Futures, and Stocks involve a risk of loss. Please consider carefully if such trading is appropriate for you. Past performance is not indicative of future results.
If you liked our ideas, please support us with your likes 👍 and comments.

TIA/USDT descending channel bullish horizons? 👀 🚀 TIA Analysis💎 Paradisers, brace yourselves for an enthralling venture with #TIAUSDT! It's stamping its presence in a support zone, signaling a potential bullish journey ahead.
💎 Having escaped a descending channel, #TIA is on the rise. Currently, it's mustering strength for a bullish breakout from the $15.25 support zone, with aspirations to overcome formidable resistance levels.
💎 Should this bullish wave persist, we're eyeing LSE:TIA to take on the $18.15 resistance zone. Breaking through this barrier could pave the way to tackle even loftier resistance heights.
💎 Conversely, should #TIA face hurdles and begin to falter, a bullish maneuver from the $14.09 support level could become our strategic response. However, dropping below this critical threshold might spell a significant downturn.

TIAUSDT.PI think this good idea for TIAUSDT.P
If the closing is still above the DEMAND ZONE i want to open LONG.
And than target to $21

