DXY Bullish Gartley pattern—look for buy opportunities. Demand zone and the market is doing higher high.
DXY trade ideas


Dollar index has broken trendline-Early sign of trend reversalDollar index has broken trendline-Early sign of trend reversal. Fundaments are in favour of USD stenthening.

USXUSD D1 FTBOHLC Profile for Monthly Candle
Weekly FVG Delivery Lower
D1 FTB
H4 BOS
HOTW Set
FOMC Delivery towards Previous Monthly Low
Buckle up...

bullish bias if inflation remains elevated.DXY is firming after last week’s strong US jobs data, which beat expectations and reduced the odds of an early Fed rate cut.
Bullish bias, especially if inflation remains elevated.
Be ready to adjust to both sides of the equation.

Analysis of the DXY's Trend and Operational SuggestionsDuring today's US market trading session, from a technical analysis perspective, on the daily chart level, the stochastic indicator forms a death cross and diverges downward, which is undoubtedly a strong bearish signal. In terms of the K-line pattern, the current price continues to be under pressure from above, and the overall trend is weak. At the 4-hour level, the stochastic indicator also forms a death cross and points downward. The K-line presents a horizontal consolidation pattern in the shape of a straight line. This pattern usually indicates that the price is accumulating downward momentum, so it can be regarded as an important basis for bearish sentiment under pressure. By comprehensively considering the technical indicators of various cycles and the K-line pattern, the current market is clearly under the dominance of bears, and its weak characteristics are fully manifested.
The DXY encounters strong suppression at the mid-axis position of the daily chart, and the suppression effect is significant. Combining the current market environment and technical trends, it is expected that the DXY will continue its downward trend, and its subsequent performance remains pessimistic.
DXY
sell@99.700-99.500
tp:99-98.500
Investment itself is not risky; it is only when investment is out of control that risks occur. When trading, always remember not to act on impulse. I will share trading signals every day. All the signals have been accurate without any mistakes for a whole month. No matter what gains or losses you've had in the past, with my help, you have the hope of achieving a breakthrough in your investment.

Dollar Index (DXY) on the weekly timeframeTwo possible paths for the Dollar Index (DXY), with the price movement in the green path more likely than the red path.

EU SHORTS FOR TODAY___ Mount Olympus Capital says.I am looking for a short on the EURO. Price showing clear signs of bearish orderflow and structure with and signatures (accumulation manipulation and distribution).
Looking to target previous day and Asia session low!
LETS GET IT! and safe trading everyone.

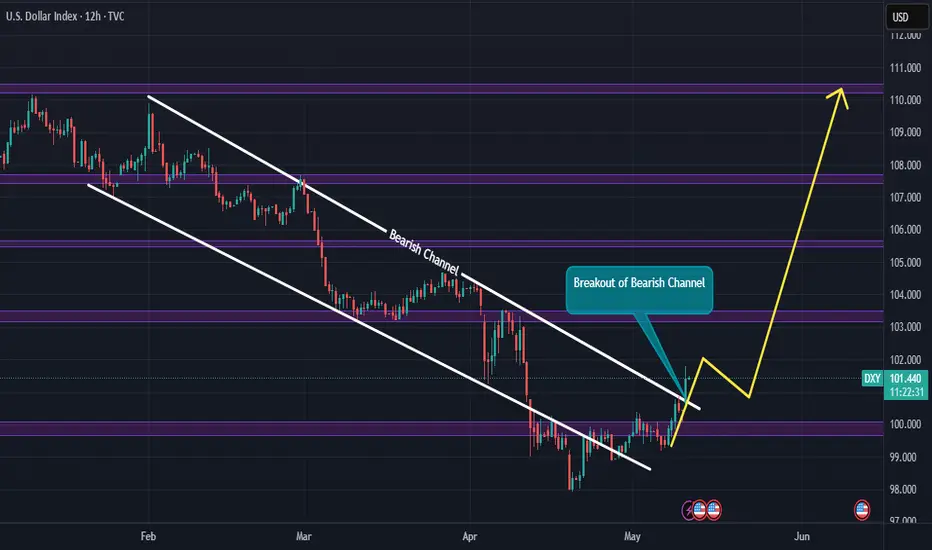
DXY Breaks out of long term Bearish ChannelThe Dollar Index TVC:DXY has finally broken out of a long term bearish channel and will most likely push back to top of the channel as Dollar Index strengthens. Expect a minor retracement to the bearish channel to gain momentum for the bullish move.
The financial market will likely experience many short positions/bearish moves on major FX pairs like AUDUSD, EURUSD, GBPUSD, NZDUSD, SGDUSD. Be on the lookout for such moves.
Kindly support this analysis to enable it reach to other people, and do comment your thoughts.
Check the trend It is expected that a trend change will form at the current resistance level and we will witness the beginning of a downtrend. If the index breaks through the resistance level, the upward trend will continue to the specified resistance levels. Then, there is a possibility of a trend change at this level.

Weekly Market Analysis - 10th May 2025This is a weekly market analysis focusing on the forex market, particularly the DXY and EURUSD for my bias.
Hope you find this video insightful.
- R2F Trading

DXY Will Go Higher! Long!
Please, check our technical outlook for DXY.
Time Frame: 9h
Current Trend: Bullish
Sentiment: Oversold (based on 7-period RSI)
Forecast: Bullish
The market is approaching a key horizontal level 100.428.
Considering the today's price action, probabilities will be high to see a movement to 102.304.
P.S
Please, note that an oversold/overbought condition can last for a long time, and therefore being oversold/overbought doesn't mean a price rally will come soon, or at all.
Disclosure: I am part of Trade Nation's Influencer program and receive a monthly fee for using their TradingView charts in my analysis.
Like and subscribe and comment my ideas if you enjoy them!

DXY: Sharing of the Trading Strategy for Next WeekAll the trading signals this week have resulted in profits!!! Check it!!!👉👉👉
On Friday, the U.S. Dollar Index fell by 0.3% and closed at 100.338. If the U.S. Dollar Index drops below the support level of 100.20 - 100.40, it is likely to retreat to the 50-day moving average of 99.81. In terms of trading operations, one can try to open a short position with a small position near 100.40, and at the same time, pay attention to the U.S. economic data and the dynamics of trade policies.
Trading Strategy:
sell@100.80-100.40
TP:99.50-90.00
The signals in the Signature have brought about continuous profits, and accurate signals are shared every day. Hurry up and click to get them!
👇 👇 👇 Obtain signals👉👉👉

Bullish week forecast for DXYWEEKLY: Tagged weekly fair value gap, could continue moving higher
DAILY & 4h: Still showing bullish order flow on daily and 4h. Potential internal to external range move

My Thoughts #006My Thoughts
Are that we still continuing with the bullish trend still waiting for a choch on the 4h demand zone to take my trade as illustrated...
We need to see the pair move from bearish to bullish trend in line with the overall trend
The pair could sell
use proper risk management
Let's do the most

"DXY is building a textbook bullish flag — here’s exactly where For Traders (technical + confident)
DXY bulls gearing up for a double-leg rally”
1. Context & Market Structure:
After a sharp impulsive drop (green falling wedge), DXY has begun corrective accumulation in an ascending channel.
Current price 99.531 is consolidating inside a broadening bullish flag pattern.
Key Zones:
Major supply zone: 100.500 – 101.000 (highlighted yellow box)
Short-term resistance: 99.700
Short-term support: 98.8Projected Path (2 bullish legs):
First push (red path): Minor pullback → break to ~100.100
Second push (blue path): Consolidation → breakout towards 100.500–101.000 (target zone)
00–98.500
Bias:
Short-term bullish → Targeting supply zone around 100.5–101.0
Invalidation level: Clear break below 98.500 (would negate bullish setup)
>
Trade Idea:
Buy on dips within the ascending flag, targeting 100.100 and 100.500
Watch reaction near supply zone for possible reversal or continuation

eurusd to 1.1265, dxy confluence eurusd mirrors the dollar and from my analysis i anticipate the dxy to gravitate towards the daily volume imbalance 100.80 zone this will cause the euro to plummet to lower prices so i spotted smooth lows of 1.1265 for first target and daily bullish fvg high for final target at 1.12 zone

DXY BULLISH According to my analyze DXY 4H chart is bullish to me. hope market will get reaction to bullish side after mitigating this 4H +OB

Sharing of the Latest Trading StrategyAll the trading signals this week have resulted in profits!!! Check it!!!👉👉👉
On Friday, the U.S. Dollar Index fell by 0.3% and closed at 100.338. If the U.S. Dollar Index drops below the support level of 100.20 - 100.40, it is likely to retreat to the 50-day moving average of 99.81. In terms of trading operations, one can try to open a short position with a small position near 100.40, and at the same time, pay attention to the U.S. economic data and the dynamics of trade policies.
Trading Strategy:
sell@100.80-100.40
TP:99.50-90.00
The signals in the Signature have brought about continuous profits, and accurate signals are shared every day. Hurry up and click to get them!
👇 👇 👇 Obtain signals👉👉👉

DXY Weekly ForecastDXY Weekly Forecast
- in any case DXY has to come down to 96.000 level
"I Found the Code. I Trust the Algo. Believe Me, That’s It."

DXYlets see how this will go, may be is going to take effect on some major pairs and crypto...
am looking forward to use this as case study of any usd pair i will like to pick. if i dont see opportunity today, opportunity will surely show up tommmoro

Looking for Longs in DXYDXY Looks good to look for longs. Arguably, I will be looking for scalping longs only on Friday. This is due to no high impact news to drive price, hence, we might face consolidation on higher timeframe.

DXY - ANALYSIS👀 Observation:
Hello, everyone! I hope you're doing well. I’d like to share my analysis of DXY (Dollar Index) with you.
Looking at the DXY chart, I expect a price increase towards 101.267. After reaching this level, I anticipate a decline to around 96.00.
📉 Expectation:
Bullish Scenario: Price increases towards 101.267.
Bearish Scenario: After reaching 101.267, a decline to 96.00.
💡 Key Levels to Watch:
Resistance: 101.267
Support: 96.00
💬 What are your thoughts on DXY this week? Let me know in the comments!
Trade safe
