IMP update for all Forex Traders Expect the Dollar Index (DXY) to appreciate in the near future. However, a further decline into the green highlighted region is possible before this upward movement. The green zone represents a potential key reversal area. Monitor the following currency pairs for trading opportunities if the DXY begins to climb:
BUY - USDCAD, USDCHF, USDSGD;
SELL - EURUSD, GBPUSD
DXY trade ideas

DXY (LONG)
Inverse Head and Shoulders pattern
Which Serves as reversal pattern
Dollar strength coming

Slower Inflation Growth, Takes DXY lower.Overnight, the DXY traded lower, driven by 2 main factors.
1) The release of lower-than-expected CPI data at 2.3%
2) Rejection of the long-term bearish trendline and the area of confluence formed by the 61.8% and 38.2% Fibonacci retracement levels from the longer term.
If the DXY breaks below the 38.2% Fibonacci retracement level of the shorter term, we could expect to see further downside, toward the target level of 100.
This round-number level would align with the 61.8% Fibonacci retracement level and the short-term bullish trendline.

Correction It is expected that the downtrend will end at the support levels and we will see the start of the uptrend. Otherwise, the downtrend may continue to the next support level.

UXY suggesting a medium-term bullish structure.riggering bullisH Awais Ali: 1. Structure & Market Context
Trend Channel: The price action is contained within a clearly defined ascending channel, suggesting a medium-term bullish structure.
Support Zone: A horizontal support area is marked around the 99.00 level, which previously served as a strong demand zone, triggering bullish momentum.
Break of Structure (BOS): A previous significant support level was broken to the downside (noted as “BOS”), indicating a change in market structure at that point. However, the current structure has resumed an upward trend.
2. Trade Setup
Current Price Level: Around 101.39.
Entry Zone: Near the midline of the channel, marked by a slight retracement after a recent high.
Target Zone: Projected at 103.009, suggesting a bullish continuation toward the upper boundary of the ascending channel.
Stop Loss Zone: Below the blue entry box, near 100.481–100.231, indicating a well-defined risk zone.
Risk-Reward: Favorable, with a substantial upside potential relative to the defined stop level.
3. Technical Indicators & Tools
Channel Lines: Used to map the upper and lower bounds of the trend.
Box Zones: Highlight entry and exit zones for trade planning.
Arrow Projection: Suggests a potential price retracement followed by continuation to the upside.
---
Professional Interpretation
The chart reflects a bullish outlook on the U.S. Dollar Index, supported by a well-established ascending channel, strong support structure, and a potential correction before continuation. The trader is likely anticipating a bullish reversal from the current retracement area, targeting a new high around 103.00, which aligns with the previous swing level.
This analysis is methodical and uses sound price action principles—ideal for swing traders or short-term position traders seeking directional bias and clear trade execution zones.
Awais Ali: bullish reversal from the current re

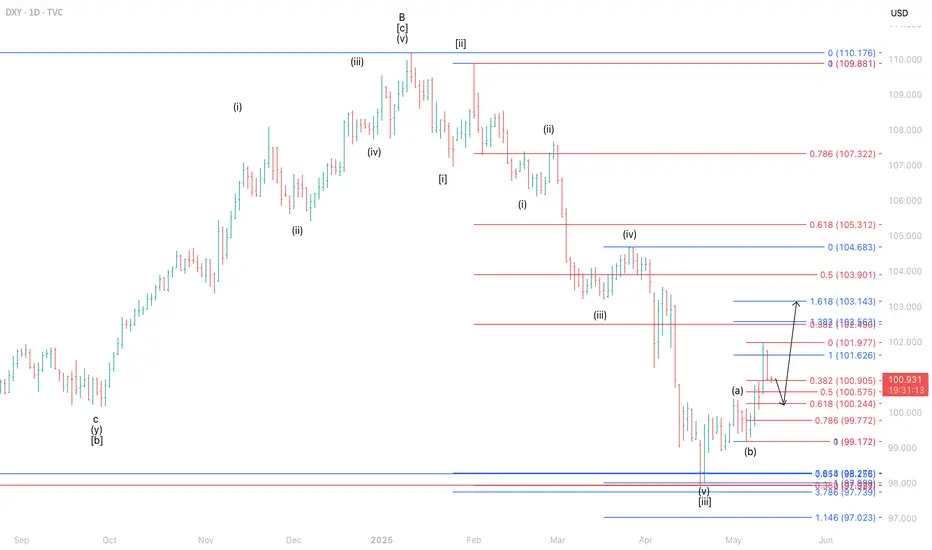
Short-Term Pullback Expected for DXY Before Potential ReboundThe current position of the DXY is estimated to be in wave ii of wave (c) of wave . This implies that the DXY remains vulnerable to a correction toward the 100.244–100.905 area. Subsequently, there is a potential for a rebound, with the index likely to retest the 102.563–103.143 zone.
$DXY Up, M2 Money Supply DownWhen the DXY goes UP,
M2 Money Supply goes DOWN.
Remember the 12-Week Lead correlation with CRYPTOCAP:BTC

After a rock-bottom RSI on DXY, is XAUUSD due for a fall? I thinIts no mystery that the DXY has an inverse mirroring relationship with XAUUSD. When DXY goes down, XAUUSD usually rises.
The RSI for DXY has been bottom of the barrel for a long time now, and combined with a recent break in structure, due certainly due for a temporary rise, which doesn't bode well for XAUUSD in the short term. I placed my SL around 3,254 and TP around 3,243, two key areas of support and resistance from an SMC perspective.

DXY road to 118.BULLISHUsing EWP ,DXY is printing wave Y of (Y) of X2 of a triple complex,targeting 117-118 resistance zone before an actionary wave Z drop all way to mid 90s

crypto & against dollar pairs dump. i'm calling it now.at this point i can pretty much say anything i want so it might as well be this lmfao

DXY:Sharing of the Latest Trading StrategyToday,we have successfully achieved a target of 120 points. resulted in profits! Check it!👉👉
Today, the DXY strengthened significantly and closed at 101.73. Technically, it has broken through the key level of 101.50. In the short term, attention should be paid to the resistance level of 102.20. If this level is broken through, the upward space will be further opened up. The support level below is 100.20. The easing of Sino - US trade tensions has promoted the rise of the US dollar. There are still more trade agreements to be released in the future, and the outlook for the US dollar index remains bullish. In terms of trading operations, aggressive investors can consider opening a long position with a small position near 101.20.
Trading Strategy:
buy@100.20-101.00
TP:101.80-102.20
The signals in the Signature have brought about continuous profits, and accurate signals are shared every day. Hurry up and click to get them!
👇 👇 👇 Obtain signals👉👉👉

DXYWeekly timeframe, long-term analysis to know how this gonna affect XXXUSD Pairs
I talked about this on a video on 22 April, where I started with EURUSD first and spoke also about DXY

DXYT BUBBLES THROUGH 103.000'S .. The DXY completes its bearish sweep and is now reacting to a substantial demand zone around the 97.000s, prompting a potential pullback toward the 103.000s. Simultaneously, the gold market faces renewed supply pressure in alignment with fundamental drivers. Market participants should anticipate corrective moves across both assets. Follow for more insights , comment , and boost idea .

US Dollar Into Resistance on China Tariff Agreement- First TestNews of a preliminary trade agreement between the U.S. and China fueled a rally of more than 1.1% in the US Dollar with the index surging into confluent downtrend resistance today at 101.77/92 - a region defined by the objective September high and the high-day close (HDC). A topside breach / close above this threshold is needed to suggest a more significant low was registered last month / invalidate the February downtrend.
Near-term bullish invalidation now raised to 99.96 with a breach here exposing 102.95/99 and the 200-day moving average into 104.04/30 . Keep in mind we have U.S. CPI on tap tomorrow. Review my latest US Dollar Short-term Outlook for a closer look at the near-term DXY technical trade levels.
-MB

DXYU.S Dollar Index
- Completed " 12345 " Impulsive Waves
- Break of Structure
- S / R Level
- Fibonacci Level - 38.20% / 50.00%
- Order Block

DXY: Strong Growth Ahead! Long!
My dear friends,
Today we will analyse DXY together☺️
The price is near a wide key level
and the pair is approaching a significant decision level of 100.977 Therefore, a strong bullish reaction here could determine the next move up.We will watch for a confirmation candle, and then target the next key level of 101.548.Recommend Stop-loss is beyond the current level.
❤️Sending you lots of Love and Hugs❤️

DXY Has More To The UpsideDXY is right now in what I believe to be a 4th wave correction, which has turned into a wxy, and probably also will turn into a WXYXZ.
It has plenty of room to develop.
Since 4th wave corrections has a tendency to enter the area of the 4th wave of previous impulse, it will most likely go up to the area of the green rectangle above.
This will be between 103.2 - 104,7.
If it will go further up before heading down is to early to say.
But my previous forecast about it will go down below 96 is still in play and intact.

DXY 12 May updatefinally moving up after long consolidation phase
we either move up another phase(preferred) or drop(not likely as huge one sided usd short position unwind)
As this keeps moving up, usdjpy usdcad usdchf etc rise, eurusd gbpusd etc falls

DXY MMBM confirmed - Bullish ThesisDXY exited the first stage distribution confirming we are bullish and in a marked maker buy model.
I expect CPI to retrace price and resume the bullish weekly trend afterwards.

$DXYTVC:DXY might see a small bull run.
Trump’s executive order to slash prescription drug prices by up to 80% could boost global demand for cheaper U.S. meds, increasing dollar inflows and supporting strength in the greenback.

DXY Long Buy Entry To Resistance (Next Week?)DXY: Long buy entry to resistance, not many large buyside wicks to retrace to help push it along but i believe that level will be tested first fairly soon. goodluck fellas.

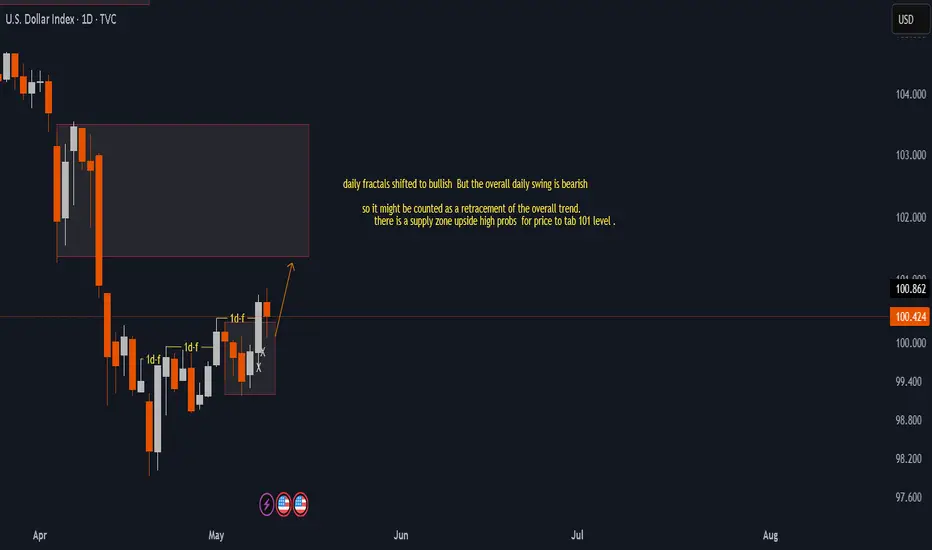
Dxy updateAs discussed last time , the DXY is perfectly moving toward major supply zone ( 101) level.
lets' wait and see how next week will behave.
check the trendIt is expected that after some fluctuations and corrections, the upward trend will continue.
If the index crosses the support trend line, the continuation of the correction trend to the specified support range will be possible.
