Possibility of uptrend A trend change is expected to form within the current support area and we will see the start of an uptrend. A break of the resistance trend line will be confirmation of the uptrend.
DXY trade ideas

Gold, Nasdaq & USDI am comparing the relationship between Gold, the Nasdaq and the US Dollar.
Since 2000, here are approximate returns for each;
Gold up 550%
S&P up 254%
DOW up 364%
Since 2020:
In the past 5 years, this shifted slightly with Gold up about twice as much as the Nasdaq.
Since 2024:
In the past year, Gold has outpaced the Nasdaq 5:1 on gains.
__________________________________________________
The dollar had three notable high gain/peak years in;
1985
2002
2022
Those peak dollar years occurred when the market was in a correction phase, selling off before the next rally, and followed a bull market rally. After each of those peak dollar years, a market rally occurred that lasted from a few months to a few quarters with substantial gains. Typically when the dollar is strong, gold prices have been suppressed. If the dollar weakens, it may allow Gold to continue a rally. We may have already seen that market rally, which just peaked in December 2024 after the dollar peaked in 2022.
If the dollar continues to lose strength, Gold prices will likely continue to rise.
from Bloomberg 4 days ago:
"A dollar gauge is on track for its worst performance during the first 100 days of a United States presidency in data going back to the Nixon era, when America abandoned the gold standard and switched to a free-floating exchange rate."
The correlation between Gold and Equities lacks any data to support, especially considering the past 20 years of market data. Gold's relationship with the markets is an algorithm that includes the US Dollar. If the dollar is strong, we see Gold prices suppressed. When the dollar is weak, we see Gold prices unlocked and free to make gains. That's where Gold is now.
Forecast:
The only information available to base a forecast for Gold pricing would be the US Dollar based on the economic relationship of the USD and Gold. Since the dollar has pulled back slightly and appears to be in a slightly downward trajectory, it is expected that Gold prices will continue to gain, although likely at a slower rate.
Since the Dollar peaked in 2022, followed by a bull market for several quarters after that event, the Nasdaq is likely headed further into correction territory followed by a consolidation phase before beginning another bull market. The Nasdaq is currently in the second annual financial quarter of a pullback that will likely last several more quarters. This market correction began in December 2024.

DXY 4H Chart AnalysisThe U.S. Dollar Index is currently consolidating near the 99.400 level, within a broader bearish trend. Price is sitting just above key H4 support (~99.000), making this a critical decision zone.
Bullish scenario: Rejection from 99.000 could lead to a retracement towards 100.000, and potentially 102.500 if momentum holds.
Bearish scenario: A break below 99.000 would confirm further downside, possibly targeting 97.500 and beyond.
Traders should wait for clear price action confirmation before committing to a direction.

DXY Bullish move| 🔹 Pair / TF | DXY, 1 h → Lower Timeframes |
| 🔹 Bias | Bullish (buying potential support) |
📊 Key Levels
Level: ~99.117 (orange shaded zone)
Role: Recent Swing Low / Potential Support Zone
Level: ~98.744
Role: Lower boundary of the potential support zone
Level: ~99.727
Role: Potential Resistance (previous swing high)
Level: ~100.116
Role: Higher Potential Resistance
🚨 Trigger
Price has recently touched the ~99.117 - ~98.744 orange shaded zone, which appears to be acting as a potential support area.
There are signs of potential rejection from this zone, indicated by the recent upward price action.
Look for bullish confirmation signals on lower timeframes within this zone.
✅ Confirmation
Observe lower timeframes (e.g., 15m, 5m) for bullish reversal patterns such as double bottoms, bullish engulfing candles, or pin bars forming within the support zone.
The volume indicator at the bottom shows increasing buying volume within the support zone, suggesting potential accumulation.
Look for the Stochastic or RSI on lower timeframes to show oversold conditions followed by a bullish crossover or break above a downward trendline.
No significant bearish momentum or strong selling volume evident as price tests the support zone.
🎯 Entry & Stops
| 🔶 Entry Zone | ~99.117 – ~98.800 (within the potential support zone) |
| 🔴 Stop-Loss | Below the lower boundary of the support zone, potentially around ~98.600 - ~98.500 to allow for some buffer |
Place a Buy Limit or Buy Stop order within the entry zone, depending on your preferred entry style and confirmation.
Risk: Determine your position size based on your risk tolerance and the calculated stop-loss in pips.
🎯 Profit Targets
| Target | Level | Pips (approximate) | RRR |
| :----- | :--------- | :----------------- | :--------- |
| T1 | ~99.727 | ~60-70 | 1 : 1 or better |
| T2 | ~100.116 | ~100-120 | 1 : 1.5 or better |
Scale out:
Consider taking partial profits at T1.
Let the remaining position run towards T2, potentially adjusting your stop-loss to breakeven or in profit.
⚙️ Trade Management
Once the trade is in profit (e.g., reaching a certain pip gain or T1), consider moving your stop-loss to breakeven to protect your capital.
Monitor price action around T1. If there are strong signs of selling pressure, consider closing the remaining position.
Pay attention to any potential resistance levels or significant selling volume as price approaches your target levels.
🔑 Rationale
Price is testing a recent swing low area, which has the potential to act as support.
Increasing buying volume within the support zone suggests that buyers are stepping in.
Bullish reversal patterns on lower timeframes would confirm the rejection of the support zone.
Aiming for the previous swing high (~99.727) and the higher potential resistance (~100.116) provides logical profit targets.
⚡ Highlight:
This is a bank-order-flow style fade, looking to buy at a potential support zone after a recent pullback, anticipating a reversal and continuation of potential upward momentum. The increasing buying volume within the support zone is a key observation.

DXYIf we look at nature's theory , we can define see that the impulsive phase is to the upside and the market corrects to the down side.
We have a clear uptrend with 2 confirmed touches and now anticipating a bullish impulse on the third touch
The third touch is also a third touch of a pattern with 2 confirmed touches waiting for the final touch to go
Multiple confirmations

$USD Breaks Down – “Mission Accomplished” or Just Getting📉 The US Dollar Index ( AMEX:USD / TVC:DXY / $USINDEX) has officially broken beneath the multi-year support zone from 2020, right as Trump prepares to declare "Mission Accomplished".
From Inauguration to Liberation Day, and now the final stage: Meltdown.
🧭 Key Events Marked:
🟥 Inauguration
🟥 Trade War
🟥 Liberation Day
🟩 Mission Accomplished
🔻 Meltdown incoming?
📊 The breakdown aligns with a sharp spike in Nasdaq down volume (see chart). This isn't just a currency move — it's a market-wide stress signal.
Watch closely:
TVC:DXY below 99 = structural weakness.
Risk-on assets may melt up temporarily, but volatility could snap back fast.
Global currency pairs ( FX:EURUSD , FX:USDJPY , FX:GBPUSD ) are all on alert.

DXY aka usdollar 25 apr inverted head and shoulderAfter forming positive divergence, an inverted head and shoulder also formed
Not cast in stone but when price goes above the neckline, we can expect a spike up and strengthening of the USD.
Work in progress. Good luck.

DXY: Will Go Up! Long!
My dear friends,
Today we will analyse DXY together☺️
The market is at an inflection zone and price has now reached an area around 98.933 where previous reversals or breakouts have occurred.And a price reaction that we are seeing on multiple timeframes here could signal the next move up so we can enter on confirmation, and target the next key level of 99.097.Stop-loss is recommended beyond the inflection zone.
❤️Sending you lots of Love and Hugs❤️

DXY Will Go Higher! Buy!
Please, check our technical outlook for DXY.
Time Frame: 9h
Current Trend: Bullish
Sentiment: Oversold (based on 7-period RSI)
Forecast: Bullish
The market is approaching a key horizontal level 99.288.
Considering the today's price action, probabilities will be high to see a movement to 100.788.
P.S
We determine oversold/overbought condition with RSI indicator.
When it drops below 30 - the market is considered to be oversold.
When it bounces above 70 - the market is considered to be overbought.
Disclosure: I am part of Trade Nation's Influencer program and receive a monthly fee for using their TradingView charts in my analysis.
Like and subscribe and comment my ideas if you enjoy them!

Dollar Index - Short Term Relief Rally Upcoming?From the beginning of 2025, it's been nothing but pain in the markets; bearish prices on bearish prices and it's not looking like it's the ends.
But wheat happens when the market is trading one way for a long time is you tend to have short squeezes. This is where traders place and trail their stop losses above recent highs with the expectation that the market will not reverse back into the highs before continuing lower.
I believe something like this can play out this week It all depends on Sundays opening....

DXY TVC:DXY is currently struggling to break the resistance and support tho the support is most likely to pull back on 98.000 level for support bofore it shoots to the upside.

29.04.25 Morning ForecastPairs on Watch -
GBPJPY
AUDUSD
EURUSD
A short overview of the instruments I am looking at for today, multi-timeframe analysis down to what I will be looking at for an entry. Enjoy!

The Most Important Chart Right NowThe Dollar Index is one of the most important charts right now. A weak dollar means looser financial conditions. This is good for US stocks, bitcoin and gold.
The fundamentals are bearish. Both the US and China want a weaker dollar. There are issues in the US bond market, and it's a self-reinforcing cycle as US stock positions need to be currency hedged.
The backdrop to all this is, of course, massive debt and dollar debasement with more money printing on the horizon.
I like the technical picture here, and it's not a bad spot to add to shorts or enter fresh ones. Ideally, we see a pullback to 1.12 on the EUR, but we might not get it, so adding a bit now here is ok.
As always, remember trading is about risk-adjusted returns, so use a stop and keep your position size small unless you are very experienced.

DOLLARThe U.S. Dollar Index (DXY) is currently in a bearish phase, trading near 98.93 as of late April 2025, down from 99.71 earlier in the month. Key drivers include:
Political Uncertainty: Trump’s tariff policies (e.g., 25% levies on auto/semiconductor imports) and trade tensions have eroded the dollar’s safe-haven appeal, despite initial short-lived gains.
Fed Policy Expectations: Markets anticipate Fed rate cuts in 2025 if inflation cools, weakening the dollar. The Fed’s cautious stance in recent minutes has reinforced this outlook
Rising Treasury yields reflect inflation concerns and foreign selling, yet the DXY has weakened due to political risks and growth fears.
Basis trades (exploiting price gaps between Treasuries and derivatives) have amplified volatility, with an estimated $800B– MIL:1T at stake.
Divergence Signals:
The DXY-Treasury spread (usually correlated) has diverged, suggesting markets doubt the Fed’s ability to sustain higher rates despite sticky inflation. This divergence often precedes shifts in risk asset pricing.
Fed Policy Impact:
Fed minutes emphasize data dependency, delaying rate cuts until inflation eases convincingly. However, bond markets are pricing in 1–2 cuts by year-end, weakening the dollar.
Outlook and Critical Levels
Bond Yields: Likely to stabilize near 4.5% for 10-year Treasuries if inflation moderates, but geopolitical risks and tariff escalation could drive further volatility.
Conclusion
The DXY’s bearish bias persists amid political uncertainty and Fed dovishness, while bond markets face turbulence from inflation and foreign capital flows. Traders should monitor:
Fed rhetoric and U.S. inflation data (core PCE, CPI).
Geopolitical developments (U.S.-China trade talks, tariff adjustments).
This interplay suggests continued volatility, with the DXY likely to underperform unless Fed policy or risk sentiment shifts abruptly.

USXUSD HOTW FrameworkUSXUSD HOTW Framework
Expansion delivery from Wednesday onwards.
April Lows Target, Previous Monthly Low by the time we will see the expansion occur.
Let's see if Medz is right once again

Is the US Dollar Preparing for a Bullish Comeback?The DXY is currently maintaining a bullish setup amid trade negotiations, election developments, and anticipation of key leading U.S. economic indicators this week.
An inverted head-and-shoulders formation is visible on the 4-hour time frame. A decisive catalyst and a breakout above the 100.00 and 100.30 levels are needed to confirm a more sustained bullish bounce from multi-year lows, with targets at 102.00, 103.30, and 104.70 — reversing recent strength in major global currencies.
On the downside, a breach of the 97.00 level could trigger a decline toward the lower boundary of the long-term uptrend channel established since 2008, aligning with the 92.00 zone, and potentially lifting gold and major currencies globally.
Several key events this week could challenge or reinforce the current bullish setup amid ongoing Trump–China trade negotiations:
U.S. Advance GDP & Core PCE — Wednesday
BOJ Rate Decision & U.S. ISM PMI — Thursday
U.S. Non-Farm Payrolls — Friday
Mega Cap Earnings — Wednesday/Thursday
While long-term signals remain bearish, short-term charts suggest a potential bullish recovery, with trade negotiations likely to tip the balance.
Written by Razan Hilal, CMT

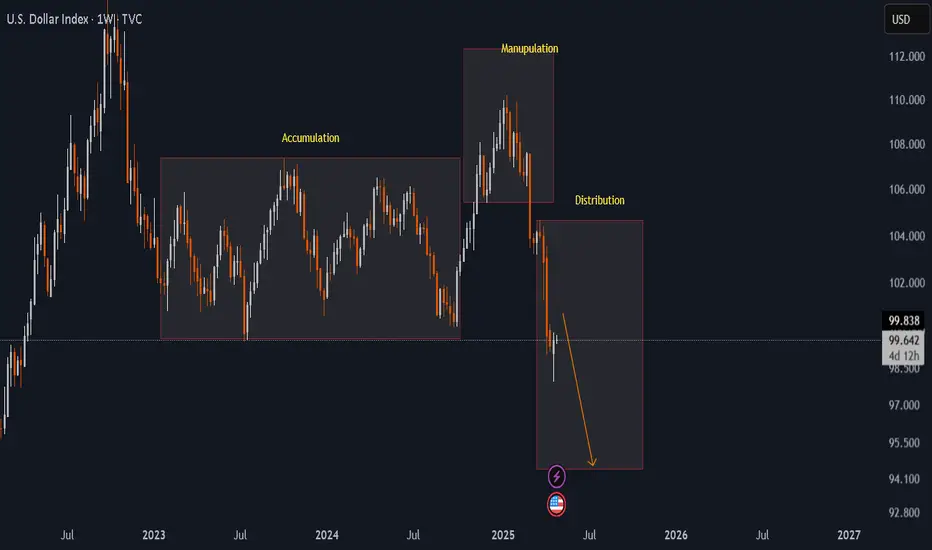
DXY updateDXY performing exactly what it performed when Last time TRump became president.
and Technically created a very clear AMD structure.
Now it is in Distribution zone...
USD StrengthGiven the current technical indicators and fundamental backdrop, the DXY may continue to face downward pressure in the short term. However, strong economic fundamentals and potential shifts in Federal Reserve policy could provide support, leading to a stabilization or potential rebound.

DXYU.S Dollar Index
- Completed " 12345 " Impulsive Waves and " AB " Corrective Waves
- Break of Structure
- Resistance Level
- Consolidation Phase
- Order Block

Heading into pullback resistance?US Dollar Index (DXY) is rising towards the pivot which is a pullback resistance and could reverse to the 1st support which acts as a pullback support.
Pivot: 100.27
1st Support: 98.32
1st Resistance: 101.77
Risk Warning:
Trading Forex and CFDs carries a high level of risk to your capital and you should only trade with money you can afford to lose. Trading Forex and CFDs may not be suitable for all investors, so please ensure that you fully understand the risks involved and seek independent advice if necessary.
Disclaimer:
The above opinions given constitute general market commentary, and do not constitute the opinion or advice of IC Markets or any form of personal or investment advice.
Any opinions, news, research, analyses, prices, other information, or links to third-party sites contained on this website are provided on an "as-is" basis, are intended only to be informative, is not an advice nor a recommendation, nor research, or a record of our trading prices, or an offer of, or solicitation for a transaction in any financial instrument and thus should not be treated as such. The information provided does not involve any specific investment objectives, financial situation and needs of any specific person who may receive it. Please be aware, that past performance is not a reliable indicator of future performance and/or results. Past Performance or Forward-looking scenarios based upon the reasonable beliefs of the third-party provider are not a guarantee of future performance. Actual results may differ materially from those anticipated in forward-looking or past performance statements. IC Markets makes no representation or warranty and assumes no liability as to the accuracy or completeness of the information provided, nor any loss arising from any investment based on a recommendation, forecast or any information supplied by any third-party.

Bullish USIndexCurrently looking at inverted H NYSE:S and also inside channel trading which might also serve as bull flag pattern once broken to the upside. This would mean gold wil be bearish

possibility of uptrendThe upward trend is expected to start according to the specified directions and if the price breaks through the resistance area, confirmation of the upward trend will be possible.

DXY start monthly bearish trend monitoring 94.8DXY start monthly bearish trend monitoring 94.8
whoever hate Trump tarif could just dump the dollar
it's a monthly bearish trend, need 1 or 2 year to go back to above 100
make cheap dollar, lower interest rate
will see a lot of new debt and print money before dollar fly again
