TLM Bearish Flag Formation – Short Opportunity Ahead?#TLM is currently forming a Bearish Flag pattern on the 4H timeframe – a classic continuation setup indicating potential downside.
🔍 Key Observations:
Price is consolidating within the golden zone of the Fibonacci retracement.
We're closely watching for confirmation signals before entering a shor

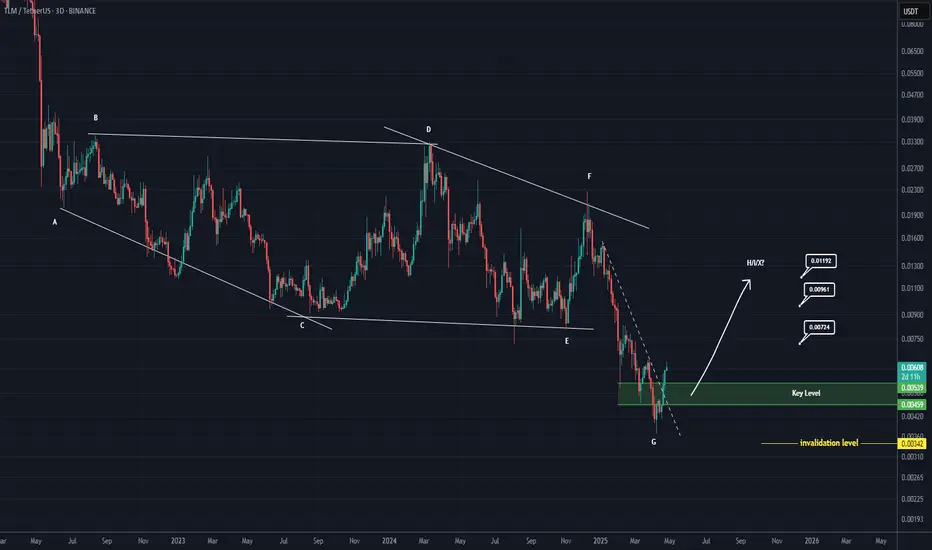
TLM Looks Bullish (3D)It seems that a diametric has completed on the chart, or Wave G of a symmetrical pattern has ended, or the price is attempting to form a bullish X-wave.
There is a key zone on the chart that the price has reclaimed, marked in green.
As long as this zone holds, the price can move toward the targets
Excited to see friends who are interested in cryptoBINANCE:TLMUSDT
"Today, I'm sharing a bit about a crypto idea that I've bought specifically for a position hold, within a timeframe of 3 days to 3 months."

TLMUSDT 1DTLM ~ 1D Analysis
#TLM This resistant line broken will confirm sustainable bullish. with a short -term target of at least 10%+.

TLMUSDT | Volume Explosion with Momentum, But Caution is KeyTLMUSDT has seen a remarkable volume explosion today, showing a serious influx of buyers that’s turning heads across the market. This kind of activity doesn’t go unnoticed. But as always, we don’t just get excited and enter randomly. We read the structure, and we react with purpose.
🟠 Key Zone to W

TLMUSDT – Watch Out! Strong Resistance AheadThe red box on TLMUSDT is a significant resistance zone, packed with a lot of sellers. This could be a tough area for price to break through, so you need to be extra cautious here.
🔴 Key Takeaways:
Strong Resistance: The red box represents a high seller concentration, which means there’s significa

TLM/USDThello friends
This currency is expected to move to the support range according to the structure that is formed.
If the range is maintained, we can see the structure change and price growth.
*Trade safely with us*

Analysis and review of TLM: Is it time to buy? Read the caption.hello friends
You can see that the price has started to fall after a strong movement to resistance and after falling, it is placed in a descending channel, which made the bottom of the channel a classic pattern for us.
Now we can enter the transaction with the successful channel failure.
And at l

#TLM (SPOT-INVEST) IN( 0.00820- 0.00950) T.(0.11500) SL(0.00818)BINANCE:TLMUSDT
#TLM / USDT
Entry ( 0.00820- 0.00950)
SL 3D close below 0.00818
T1 0.02200
T2 0.05000
T3 0.06600
T4 0.08300
T5 0.11500
3 Extra Targets(optional) in chart, if you like to continue in the trade with making stoploss very high.
______________________________________________________

#TLM (SPOT) IN ( 0.01050- 0.01250) T.(0.11500) SL(0.01012)BINANCE:TLMUSDT
#TLM / USDT
Entry ( 0.01050- 0.01250)
SL 1D close below 0.01012
T1 0.02200
T2 0.05000
T3 0.06600
T4 0.08300
T5 0.11500
3 Extra Targets(optional) in chart, if you like to continue in the trade with making stoploss very high.
______________________________________________________

See all ideas
Summarizing what the indicators are suggesting.
Oscillators
Neutral
SellBuy
Strong sellStrong buy
Strong sellSellNeutralBuyStrong buy
Oscillators
Neutral
SellBuy
Strong sellStrong buy
Strong sellSellNeutralBuyStrong buy
Summary
Neutral
SellBuy
Strong sellStrong buy
Strong sellSellNeutralBuyStrong buy
Summary
Neutral
SellBuy
Strong sellStrong buy
Strong sellSellNeutralBuyStrong buy
Summary
Neutral
SellBuy
Strong sellStrong buy
Strong sellSellNeutralBuyStrong buy
Moving Averages
Neutral
SellBuy
Strong sellStrong buy
Strong sellSellNeutralBuyStrong buy
Moving Averages
Neutral
SellBuy
Strong sellStrong buy
Strong sellSellNeutralBuyStrong buy
Displays a symbol's price movements over previous years to identify recurring trends.