TOKENUSDT 1DTOKEN ~ 1D Analysis
#TOKEN Buy after successfully penetrating this resistant line with a short -term target of at least 10%+ from here.

TOKENUSDT 2DTOKEN ~ 2D Analysis
#TOKEN Buy gradually from here if you still have a Conviction on this coin with a short -term target of at least 15%+.

[Long] TOKENUSDT from Tokenfi. RWA's on the blockchain.Hi Traders,
The swigly line on the indicator indicates a reversal. As you can see on January 30th, 2024 the swigly line indicated a reveral. With Ethereum potentially going up to $4800 you can imagine that TOKEN from Tokenfi will go up to .60 cents or more. Token from Tokenfi will put real world ass

TOKENUSDT 3DTOKEN ~ 3D Analysis
#TOKEN This is the lowest support for now, Maybe you can consider this support to start buying back from here.

TOKENUSDT Reversal Incoming – Prime Accumulation Zone! 📉 Current Market Outlook:
TOKENUSDT is currently trading in the Discount Zone, signaling an optimal BUY opportunity for smart investors. The price is hovering near a weak low, indicating potential exhaustion of the downtrend.
📊 Key Technical Insights:
✅ Break of Structure (BOS) suggests a shift in

TOKENUSDT 2DTOKEN ~ 2D
#TOKEN In 2D Time Frame, Still maintaining this support block,. Buy from here if you still have Conviction on this coin with a minimum target of 20%+


TOKEN/USDT NEW BREAK POSSIBILITY TOKEN/USDT NEW BREAK POSSIBILITY
We will follow this coin for the break possibility.

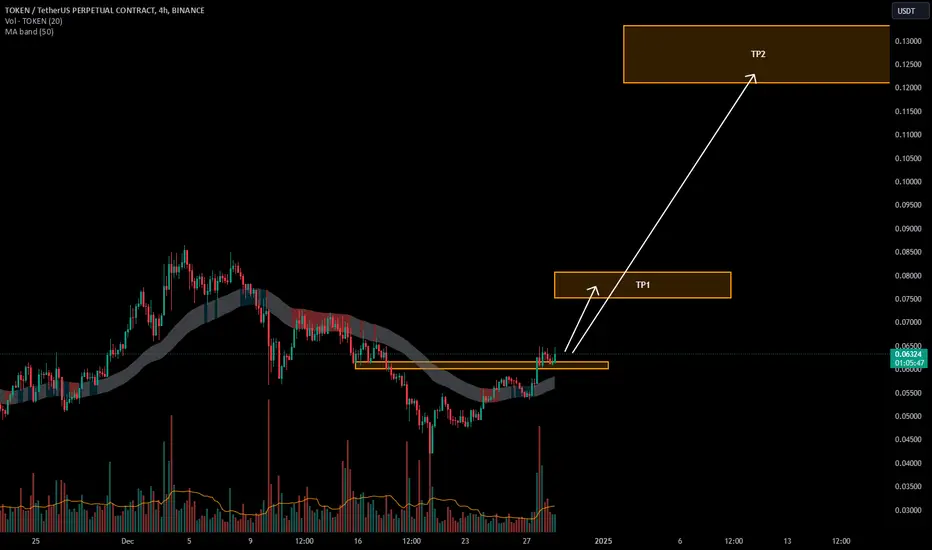
TOKEN/USDTKey Level Zone : 0.06000-0.06150
HMT v3.0 detected. The setup looks promising, supported by a previous upward/downward trend with increasing volume and momentum, presenting an excellent reward-to-risk opportunity.
HMT (High Momentum Trending):
HMT is based on trend, momentum, volume, and market st
TOKENUSDT 2DTOKEN ~ 2D
#TOKEN If you still have Conviction on this coin,. This support block would be a good buying spot for now. buy in stages with a minimum target of 20%++

See all ideas
Summarizing what the indicators are suggesting.
Oscillators
Neutral
SellBuy
Strong sellStrong buy
Strong sellSellNeutralBuyStrong buy
Oscillators
Neutral
SellBuy
Strong sellStrong buy
Strong sellSellNeutralBuyStrong buy
Summary
Neutral
SellBuy
Strong sellStrong buy
Strong sellSellNeutralBuyStrong buy
Summary
Neutral
SellBuy
Strong sellStrong buy
Strong sellSellNeutralBuyStrong buy
Summary
Neutral
SellBuy
Strong sellStrong buy
Strong sellSellNeutralBuyStrong buy
Moving Averages
Neutral
SellBuy
Strong sellStrong buy
Strong sellSellNeutralBuyStrong buy
Moving Averages
Neutral
SellBuy
Strong sellStrong buy
Strong sellSellNeutralBuyStrong buy
Displays a symbol's price movements over previous years to identify recurring trends.