ton Toncoin can move up with a small stop, and can hit previous highs. Look at the 1-hour timeframe.
TONUSDT.P trade ideas

Toncoin ($TON): Bullish Setup on 3D Chart#Toncoin ( CRYPTOCAP:TON ): Bullish Setup on 3D Chart 📈
Toncoin is forming its second bullish pennant, signaling a potential continuation of its uptrend. A breakout could see targets of $6.10, $8.00, and $10.00. Watch for volume confirmation and strong momentum to validate the move.
🎯 Key Levels: $6.10 (initial target), $8.00 (mid-term), $10.00 (long-term).
📉 Support: A dip below $5.00 may invalidate the pattern.
Keep an eye on the breakout for trading opportunities! 🚀
Is #TONUSDT Gearing Up for Breakout or Risking a Sell-Off?Yello, Paradisers! Have you seen the recent price action of #TONUSDT? Let's discuss the latest analysis of #Toncoin and see what's happening:
💎#TON is showing signals of a potential breakout from its bullish pennant structure, following several failed attempts to reclaim higher levels. Recent price action revealed a sharp rejection at the critical $5.83 resistance, stalling the bullish momentum and forcing the price to seek support.
💎The price is now heading toward a pivotal retest of the $4.54 support zone. This level is crucial as #Toncoin looks to gather fresh buying interest and maintain its bullish outlook. A successful bounce from $4.54, combined with a clean break above the $6.15 resistance, would re-establish a bullish structure. Such a move could trigger a strong upward push, significantly increasing the chances of #TONUSDT surging past current resistance levels and setting new highs.
💎On the other hand, the downside risks remain significant. If #TONUSD fails to hold above the $4.54 support zone and breaks below, the price could head toward the $3.88 demand area. This zone, while fresh, may attract buyers looking for a rebound.
💎However, if $3.88 fails to provide sufficient support and the price slips further, it would signal a decisive bearish shift. A break below this level would likely accelerate the sell-off, leading to even deeper corrections as market sentiment turns bearish.
Stay focused, patient, and disciplined, Paradisers🥂
MyCryptoParadise
iFeel the success🌴

Start of a full-scale uptrend: When it rises above 5.770-5.927
Hello, traders.
If you "Follow", you can always get new information quickly.
Please also click "Boost".
Have a nice day today.
-------------------------------------
(TONUSDT 1W chart)
The key is whether it can maintain the price by rising above 5.770.
-
(1D chart)
To do so, it must be supported around 5.469 and rise.
If it does not and falls,
1st: 5.169-5.274
2nd: 4.668
You should check for support near the 1st and 2nd above.
-
Therefore, in order to trade TON coin, it is recommended to check for support at least around 5.469.
The real buying period is when it shows support around 5.770-5.927.
Otherwise, it may pretend to rise above 5.770-5.927 and then fall.
-
Have a good time.
Thank you.
--------------------------------------------------
- Big picture
I used TradingView's INDEX chart to check the entire range of BTC.
(BTCUSD 12M chart)
Looking at the big picture, it seems to have been maintaining an upward trend following a pattern since 2015.
In other words, it is a pattern that maintains a 3-year bull market and faces a 1-year bear market.
Accordingly, the bull market is expected to continue until 2025.
-
(LOG chart)
Looking at the LOG chart, you can see that the upward trend is decreasing.
Accordingly, the 46K-48K range is expected to be a very important support and resistance range from a long-term perspective.
Therefore, we expect that we will not see prices below 44K-48K in the future.
-
The Fibonacci ratio on the left is the Fibonacci ratio of the uptrend that started in 2015.
In other words, it is the Fibonacci ratio of the first wave of the uptrend.
The Fibonacci ratio on the right is the Fibonacci ratio of the uptrend that started in 2019.
Therefore, it is expected that this Fibonacci ratio will be used until 2026.
-
No matter what anyone says, the chart has already been created and is already moving.
How to view and respond to this is up to you.
When the ATH is updated, there are no support and resistance points, so the Fibonacci ratio can be used appropriately.
However, although the Fibonacci ratio is useful for chart analysis, it is ambiguous when used as support and resistance.
This is because the user must directly select the important selection points required to create Fibonacci.
Therefore, since it is expressed differently depending on how the user specifies the selection points, it can be useful for chart analysis, but it can be seen as ambiguous when used for trading strategies.
1st : 44234.54
2nd : 61383.23
3rd : 89126.41
101875.70-106275.10 (Overshooting)
4th : 134018.28
151166.97-157451.83 (Overshooting)
5th : 178910.15
-----------------

Do you think it will cross 6$ ?If the price breaks below the moving averages, it will indicate that the sellers have maintained their selling pressure. Buyers should be able to defend the $5 level with all their strength

#TON/USDT#TON
The price is moving in a descending channel on the 12-hour frame upwards and is expected to continue.
We have a trend to stabilize above the moving average 100 again.
We have a descending trend on the RSI indicator that supports the rise by breaking it upwards.
We have a support area at the lower limit of the channel at a price of 4.60.
Entry price 4.80.
First target 5.20.
Second target 5.52.
Third target 5.82.

ARE YOU READY FOR THE PUMP?????????TON Ecosystem is looking strong day by Day expecting big PUmp in TON coin

Trading opportunity for TONUSDTBased on technical factors there is a Buy position in :
📊 TONUSDT
🔵 Buy Now
🪫Stop loss 5.200
🔋Target 1 6.500
🔋Target 2 7.250
🔋Target 3 8.300
💸RISK : 1%
We hope it is profitable for you ❤️
Please support our activity with your likes👍 and comments📝


Buy Trade TON: Driving Adoption in Decentralized MessagingDescription:
This trading idea revolves around TON (The Open Network), a cryptocurrency originally developed to complement the Telegram messaging ecosystem, now focused on creating a decentralized internet with seamless communication and transaction capabilities. TON offers a unique combination of scalability, fast transactions, and low fees, making it ideal for widespread adoption in decentralized applications (dApps), micropayments, and private messaging solutions. As demand for decentralized communication and secure transactions grows, TON benefits from its strong foundational technology and potential integrations within existing digital ecosystems.
However, it is important to understand that cryptocurrency investments, including TON, are subject to significant volatility. Factors such as regulatory developments, market sentiment, and broader macroeconomic trends can impact asset performance. Caution and strategic risk management are crucial for those engaging with TON or similar assets in the digital space.
Disclaimer:
This trading idea is intended for educational purposes only and does not constitute financial advice. Trading and investing in cryptocurrencies such as TON carry inherent risks, including the possibility of losing your entire investment. Always conduct thorough research, evaluate your personal financial situation, and consult with a financial advisor before making any investment decisions. Past performance does not guarantee future results.

TON can flyAfter the pullback in substructrue, a price compression has been created that has come out of this compression.
We have a bullish iCH on the chart.
The basic structure of TON is Boolean.
Closing the daily candle below the invalidation level will violate this analysis.
Do not enter the position without capital management and stop setting
Comment if you have any questions
thank you

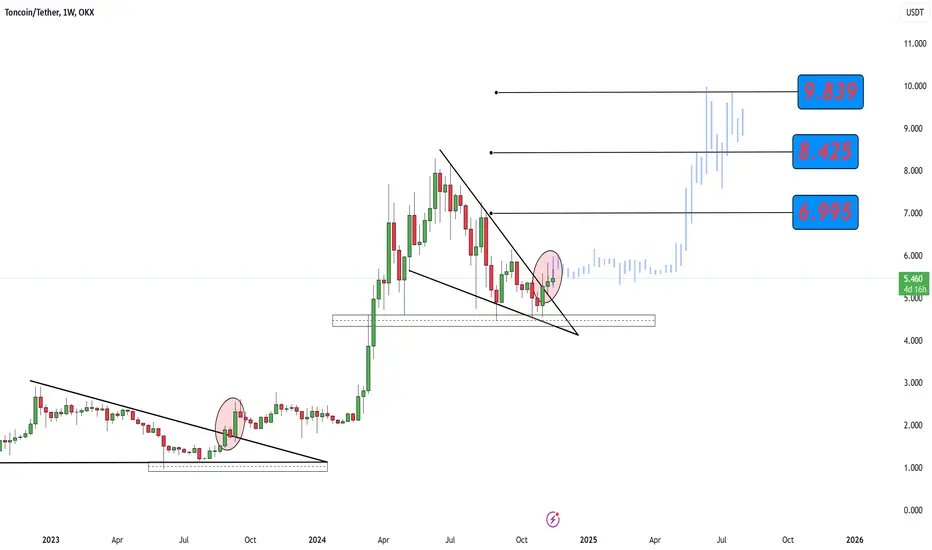
TON SPOT Setup (3D) - Nov 15 2024Looking at TON's chart it seems a breakout is close. Ton has been consolidation for several months and as long as it is above the long term yellow trendline, higher targets of 6.97, 10 and 15 are available.
The only problem that remains is BTC's possible dump to fill its CME gap.That's why the tight SL of 5.0 level is selected. If TON manages to thrust out of the consolidation pattern, it can still preserve its bullish structure despite BTC's CME gap dump.

TON/USDT ready for bullrunWe can see the green box on the fibonacci level, and if TON will manage to flip that level we'll open the real "DOOR OF THE BULL MARKET" for TON

TON goes to 10
There is no need to explain what BYBIT:TONUSDT is and what potential it has in terms of reaching Telegram users.
🗿I believe we have a good opportunity to pick up a clear move to $10.
Shaka 🤙
CRYPTO:TONUSD BINANCE:TONUSD

TON its about to explodeTON/USDT its forming a bullish structure.
Key Observations:
1. Chart Pattern:
• The price appears to be forming a symmetrical triangle pattern. This is a consolidation phase, suggesting that the price could break out in either direction.
• The narrowing of the triangle indicates decreasing volatility.
2. Indicators:
• MACD:
• The MACD line (blue) is below the signal line (orange), which indicates a bearish sentiment.
• However, the histogram is reducing in size, suggesting a potential weakening of the bearish momentum.
• RSI:
• The RSI is hovering around the middle level (between 40-60), indicating a neutral market sentiment with no clear overbought or oversold conditions.
3. Support and Resistance:
• Support: The lower blue line of the triangle represents a strong support level.
• Resistance: The upper blue line acts as resistance, limiting upward movements.
4. Current Price Action:
• The price is trading near the triangle’s apex, indicating that a breakout (upward or downward) could be imminent.
Potential Scenarios:
• Bullish Breakout:
• If the price breaks above the upper resistance of the triangle, it could target previous highs around $5.80 to $6.00.
• Bearish Breakdown:
• A breakdown below the support level might lead to a retest of the $5.00 or lower levels, around $4.80.
Conclusion:
Monitor the price closely as it approaches the apex of the triangle. Watch for increased volume during a breakout, as this often confirms the direction. Use stop-losses to manage risk, especially if trading based on the breakout.

Lingrid | TONUSDT Choppiness After the SURGEThe price perfectly fulfilled my last idea. It hit the tapped the target zone. OKX:TONUSDT is currently moving sideways after breaking through the downward trendline. The price is fluctuating back and forth, indicating choppiness in the market. Additionally, the price action suggests that the price is being squeezed, which will likely lead to a breakout. Unlike other layer-1 blockchains, TON hasn't shown significant bullish movement, suggesting that there is still anticipation surrounding the resolution of issues with Durov. Nonetheless, I expect the price to remain above the psychological level of 5.00. If it pulls back to take liquidity below the support and subsequently rejects that level, we can anticipate a bullish move toward the ATH. My goal is resistance zone around 5.730
Traders, if you liked this idea or if you have your own opinion about it, write in the comments. I will be glad 👩💻

Ton/Usdt bullish trendHello my friends. Everything you need shown for you at chart
I think price goes upper till first tp 5.85$ level
After that i will put new analysis here

TON Idea set upAt the moment everything is pumping, this chart looks bullish, broke the falling daily wedge, now currently cooling down. Keep on your watchlist. Follow me for more ideas

THE OPEN NETWORK $BINANCE:TONUSDT LONG SETUP View on Charts[/b]🚀THE OPEN NETWORK BINANCE:TONUSDT LONG SETUP View on Charts
🚦ENTRY ZONE: $5.142✅
1.Take Profit $6.112
2 .Take Profit $7.036
3. Take Profit $8.055
🛑 STOPLOSS LINE: $4.031 Wait For Confirmation Candles to Buy Long your trade.
Disclaimer: Digital asset prices are subject to high market risk and price volatility. The value of your investment may go down or up, and you may not get back the amount invested. You are solely responsible for your investment decisions and Binance is not liable for any losses you may incur. Past performance is nota reliable predictor of future performance. You should only invest in products you are familiar with and where you understand the risks. You should carefully consider your investment experience, financial situation, investment objectives and risk tolerance and consult an independent financial adviser prior to making any investment.

TONCOIN WILL KEEP GROWING|LONG|
✅TON/USDT is a coin to watch
As we are entering an Altcoin
Season again. A strong bullish
Rebound from the horizontal
Support of 4.4$ paired with
The strong bullish breakout of
The falling resistance line all
Make us bullish biased. Which,
Combined with the strong
Fundamentals of the coin,
Being a cornerstone of the
Entire telegram network and
Its internal marketplace makes
Us expect a strong bullish
Move up with the targets
Being 7.2$(+31%) and 8.2$(+51%)
Respectively.
LONG🚀
✅Like and subscribe to never miss a new idea!✅

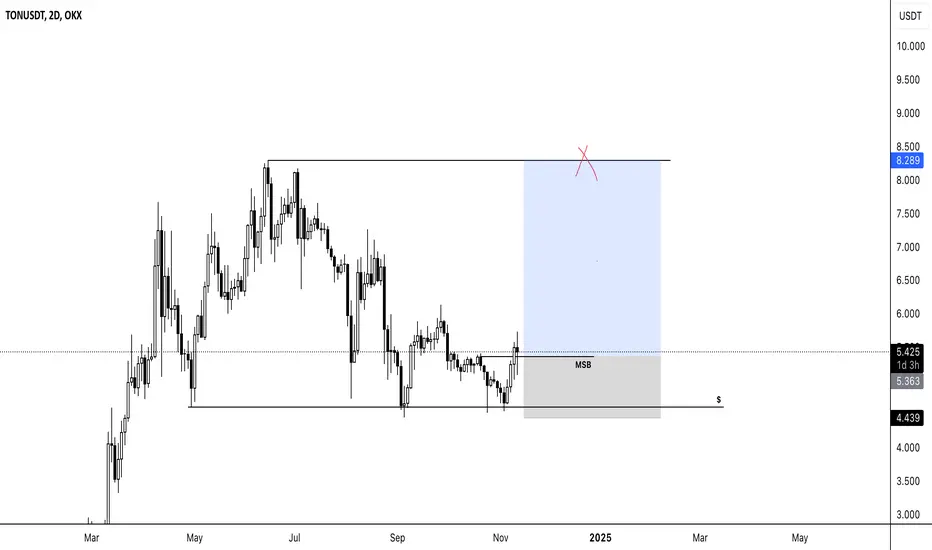
TON LONGThe 2-day chart of TONUSDT highlights a potential reversal setup after forming a market structure break (MSB) around the 5.36 USD level. Price is now showing signs of bullish momentum with a possible move toward the higher resistance zone.
Trade Plan:
- Entry: Current price level (~5.36 USD) or upon minor pullbacks if price holds above the MSB level.
- Target: 8.28 USD – aligns with a major resistance level and potential profit-taking area.
- Stop Loss: Below 4.43 USD, near recent support, to manage downside risk.
This trade setup aims to capture a continuation of the bullish structure in TONUSDT, with a favorable risk-to-reward ratio.
TON Long Spot Trade (Structure Shift & 21 EMA Reclaim) Market Context: TON has shifted its market structure, reclaiming the 21 EMA as support. This signals a potential upward move, providing a good entry point at current levels.
Trade Setup:
Entry: Enter a trade around $5.00
Take Profit Targets:
First target: $5.92
Second target: $6.84
Third target: $7.83
Stop Loss: Daily close below $4.50
This strategy aims to capitalize on the momentum shift, with tight risk management given the support level reclaim. #TON

TON technical analysis: Bullish momentum could target $7.271 witTON/USDT is currently trading around $5.379. Here’s a breakdown based on the chart:
Key Levels:
$7.271: This is the target for TON, representing potential resistance and a likely point for profit-taking if the price reaches this level. This would signify an approximate 40.5% gain from the current price.
$5.981: An intermediate resistance level that TON must overcome to continue its upward trend toward the $7.271 target.
$5.00 - $4.80: These green shaded areas represent support zones. In the event of a pullback, buyers may enter around these levels to provide support and prevent further decline.
Price Movement:
The chart indicates a potential bullish trend with a rally towards the $7.271 target. This path may involve some consolidation or minor pullbacks before the upward movement continues. It looks as though TON might test the $5.981 resistance level. If TON can break through and sustain above this level, it would increase the likelihood of reaching the $7.271 target.
Market Sentiment:
The recent breakout above support levels suggests rising buying interest, which may signal a shift toward a bullish sentiment for TON. If this trend persists, TON could reach the $7.271 target before the end of the year. However, traders should keep an eye on price action around the $5.981 resistance level.
Conclusion: Based on this technical analysis, TON has the potential to rally to $7.271, a 40% gain, if it can break through intermediate resistance levels. However, rejection at key resistance levels or a dip below support zones may slow down the upward momentum.
